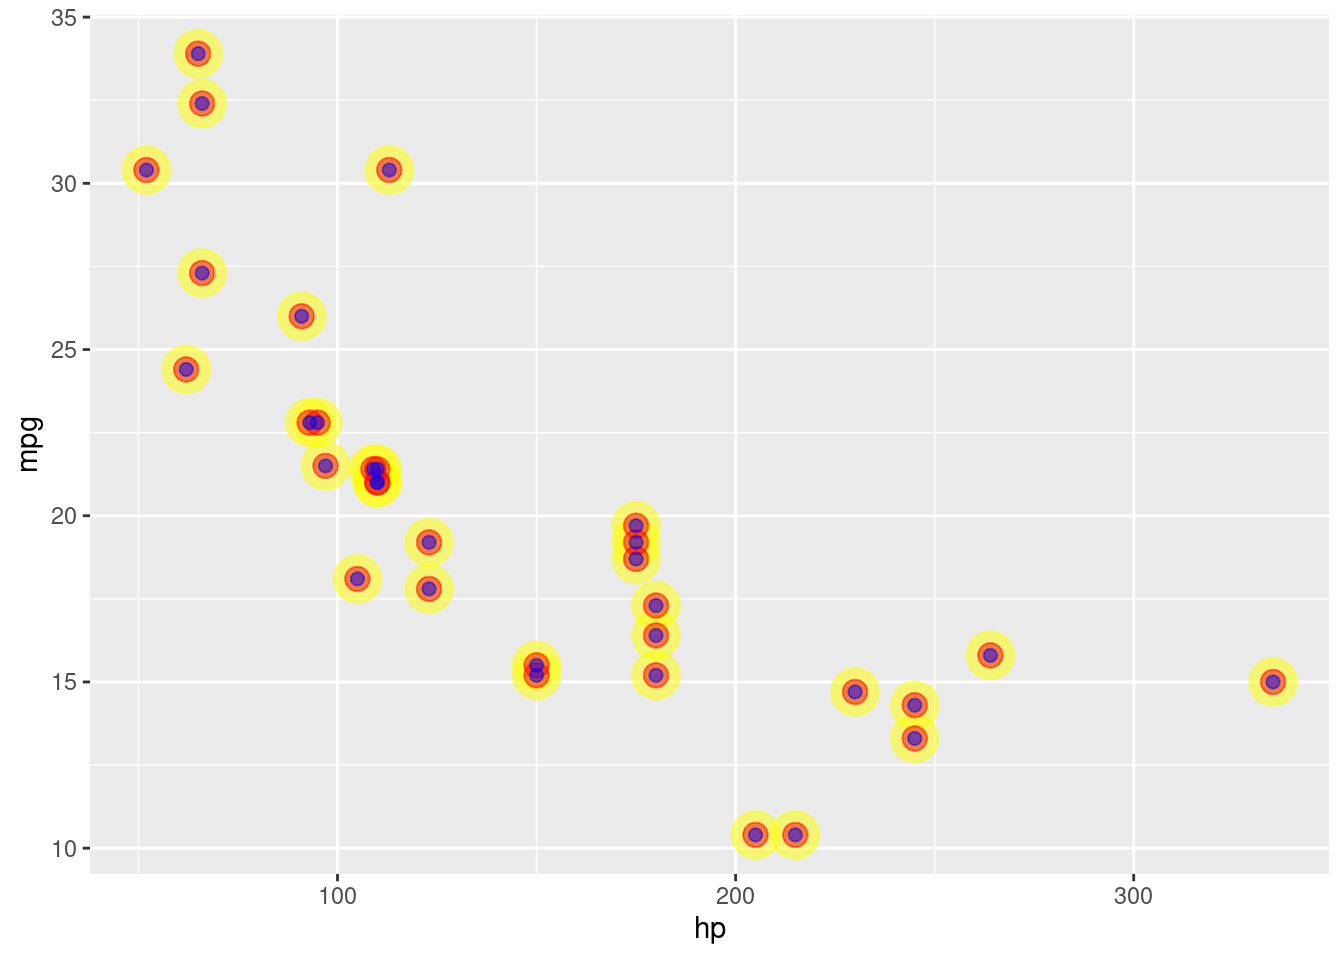
ggplot2 example with reduce
ggplot(mtcars, aes(hp, mpg)) +
  geom_point(size = 8, alpha = .5, color = "yellow") +
  geom_point(size = 4, alpha = .5, color = "red") +
  geom_point(size = 2, alpha = .5, color = "blue")
Let us use the reduce() function. Note that reduce2() takes two arguments, but the first value (..1) is given by the .init value.
reduce2(
  c(8, 4, 2),
  c("yellow", "red", "blue"),
  ~ ..1 + geom_point(size = ..2, alpha = .5, color = ..3),
  .init = ggplot(mtcars, aes(hp, mpg))
)
df <- list(age=tibble(name='john',age=30),
    sex=tibble(name=c('john','mary'),sex=c('M','F'),
    trt=tibble(name='Mary',treatment='A')))

df
#> $age
#> # A tibble: 1 × 2
#>   name    age
#>   <chr> <dbl>
#> 1 john     30
#>
#> $sex
#> # A tibble: 2 × 3
#>   name  sex   trt$name $treatment
#>   <chr> <chr> <chr>    <chr>
#> 1 john  M     Mary     A
#> 2 mary  F     Mary     A

df |> reduce(.f = full_join)
#> Joining with `by = join_by(name)`
#> # A tibble: 2 × 4
#>   name    age sex   trt$name $treatment
#>   <chr> <dbl> <chr> <chr>    <chr>
#> 1 john     30 M     Mary     A
#> 2 mary     NA F     Mary     A

reduce(.x = df,.f = full_join)
#> Joining with `by = join_by(name)`
#> # A tibble: 2 × 4
#>   name    age sex   trt$name $treatment
#>   <chr> <dbl> <chr> <chr>    <chr>
#> 1 john     30 M     Mary     A
#> 2 mary NA F Mary A- to see all intermediate steps, use accumulate()
accumulate2(
  c(8, 4, 2),
  c("yellow", "red", "blue"),
  ~ ..1 + geom_point(size = ..2, alpha = .5, color = ..3),
  .init = ggplot(mtcars, aes(hp, mpg))
)
#> [[1]]
#>
#> [[2]]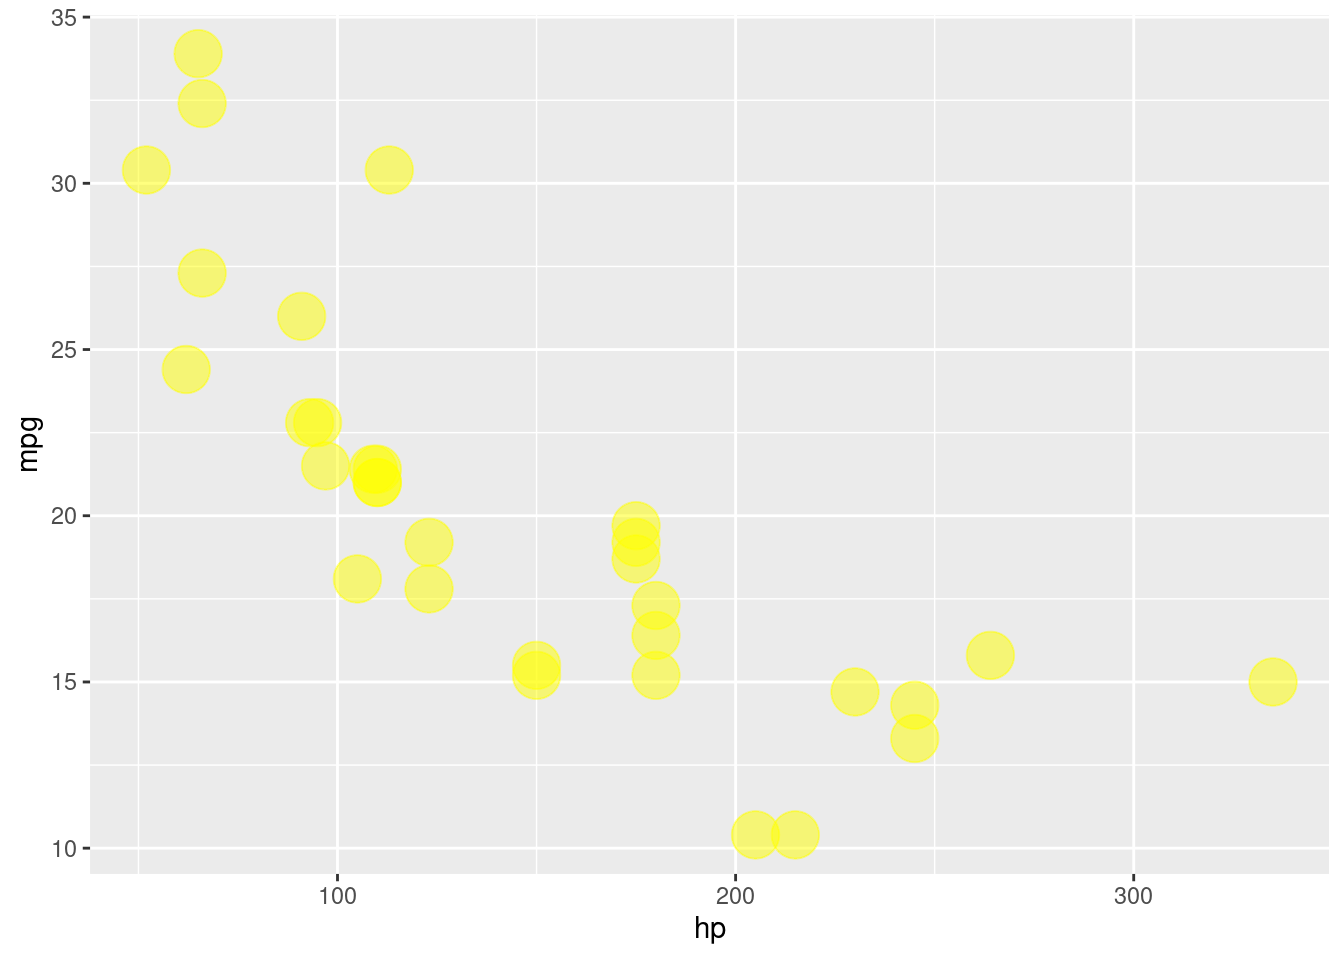
#>
#> [[3]]
#>
#> [[4]]