ROC Plots
- ROC curve = Sensitivity (True positive rate) vs. 1–Specificity (False Positive Rate) across all thresholds – shows the trade-off.
- AUC (Area Under Curve) is the overall performance indicator (1.0 = perfect, 0.5 = chance). Higher AUC = better model on average.
- Use ROC to pick a threshold that fits your needs: E.g., for initial diagnoses, you might choose a threshold giving high sensitivity (accepting more false positives to catch more true cases).
- If false positives are costly, pick a threshold with higher specificity (fewer false alarms, but you may miss some positives).
- Compare models with ROC/AUC: a higher AUC or a curve closer to the top-left means a stronger model.
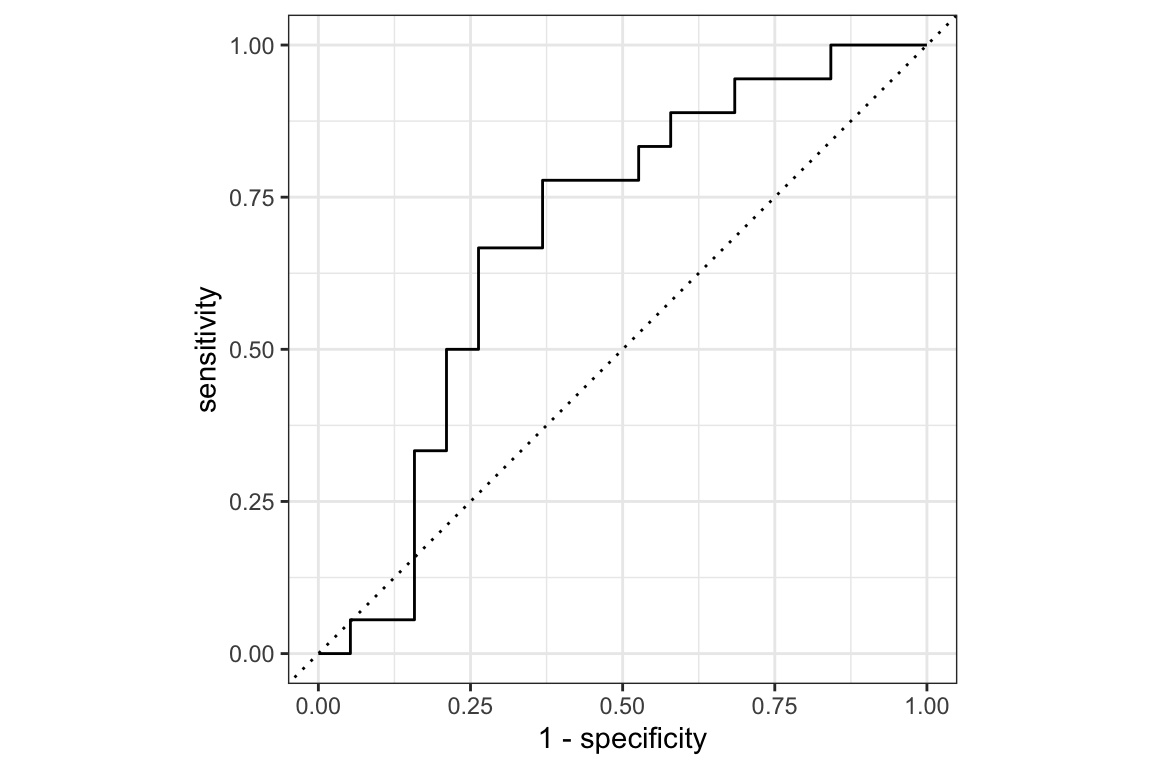
Figure 11.10: ROC Curve for Ischaemic Stroke