Health Metrics and the Spread of Infectious Diseases Machine Learning Applications and Spatial Modelling Analysis with R Book Club
Welcome
Book club meetings
Pace
1
Introduction
Overview
Structure of the Book
Main Objectives
How to use the book
Meeting Videos
Cohort 1
Health Metrics
2
Introduction to Health Metrics
SLIDE 1
Meeting Videos
Cohort 1
3
Methods and Calculations
Chapter 2 Recap
Chapter 3 overview
YLL Calculation
Example: YLLs due to Stroke
Example: Setup and Excess Deaths
Example: Life Expectancy and YLL calculation
YLD Calculation
Example: YLDs due to Stroke
Example: Disability Weights & Severity Levels
Example: Calculating YLDs for Stroke
Example: Final Calculation of YLDs
DALY Calculation
Meeting Videos
Cohort 1
4
Metrics Components
Introduction
Cause-specific or Population-wide
Life tables and Life expectancy (Motivation)
Life tables (Example data)
Life expectancy calculation
Mortality level and rates
Incidence and Prevalence
Disability Weights and Severity Levels
Summary of DALYs’ Components
Meeting Videos
Cohort 1
5
Causes and Risks
Introduction
🛑 Conditions and Injuries
💥 Risk Factors and Health Metrics
5.0.1
Risk-Specific Exposures
5.0.2
Risk-Specific Outcomes
5.0.3
Risk-Specific Populations
5.0.4
Risk Measures
Causal Inference
Summarising the Relationship Between Risk and Outcome
Meeting Videos
Cohort 1
Machine Learning
6
Introduction to Machine Learning
6.1 Deterministic and Stochastic Modelling
6.2 Machine Learning Models
6.2.1 Empirically Driven and Mechanistic Models
6.2.1 Empirically Driven Models
6.2.2 Learning Methods
6.2.3 Parameters and Hyper-parameters
6.3 The Steps of Building a Model
6.3.1 Example: Cholera
6.3.2 Example: Epidemic X
6.3.2.1 The SEIR Model
6.3.2.2 Random Forest
6.3.2.3 Optimization with Tidymodels
6.3.3 Example: Epidemic Y
6.3.3.1 INLA: an empirical Bayes approach to GAMs
6.4 Measures of Machine Learning Models
6.4.1 Loss Functions
6.4.2 Evaluation Metrics
6.4.3 Public Health Loss Functions
6.5 Final suggestions for further learning
Meeting Videos
Cohort 1
7
Techniques for Machine Learning Applications
7.1
Goals of the Analysis and Nature of Data
7.1.1
Output is
Continuous
7.1.2
Output is
Categorical
or
Binary
7.1.3
Systemic Modelling / Simulation
7.1.4
Time-Series
7.2
Statistical and Machine Learning Methods
7.2.1
Exploratory Data Analysis
7.2.2
Feature Engineering / Transforming Variables
7.3
Case Study: Predicting Rabies
7.3.1
Goal:
7.3.2
Exploratory Data Analysis (EDA)
7.3.3
Training and Resampling
7.3.4
Preprocessing
7.3.5
Multicollinearity
7.3.6
Model 1: Random forest
7.3.7
Model 2: GLM w lasso penalty
7.3.8
Additional models!
7.4
Summary
Meeting Videos
Cohort 1
8
Essential R Packages for Machine Learning
8.1
Key R-packages for ML
8.2
How to use mlr3
8.2.1
DALYs due to Dengue
8.3
How to use keras3
8.3.1
General Infection
8.3.2
Neural Network Model
8.3.3
Example Code
Meeting Videos
Cohort 1
9
Predictive Modelling and Beyond
9.1
Overview of predictive modelling
9.2
Predicting the future
9.2.1
Dengue Test Predictions for 2017-2021
9.3
Time series analysis
9.3.1
SDI Time Series Analysis with Mixed Effect Models
Meeting Videos
Cohort 1
Data Visualisation
10
Introduction to Data Visualisation
10.1 History of Data visualisation
Petroglyphs
William Playfair
Florence Nightingale
W.E.B Du Bois
10.2 The Grammar of Graphics
10.3 General Guidelines
Common types of plots and their uses
10.4 Example: Visualising Lung Cancer Deaths by Prevalence and Age in Germany
Scatter plot
Barplot
Line plot
10.4.1 Colours and Patterns
10.4.2 Theme, Legends and Guides
10.4.3 Plot Layouts
10.4.4 Saving as an image
10.5 Practising Data Visualisation
Considerations for accessibility
Contrast
Vision impairments
Accessible data tables
Additional packages for accessibility
Meeting Videos
Cohort 1
11
Interpreting Model Results Through Visualisation
Why Plot Model Fits?
Predicted vs Actual Plots
Residual Plots
Influential Observations
Comparing Models
Communicating Results
ROC Plots
Partial Independence Plots
Conclusion
Meeting Videos
Cohort 1
12
Spatial Data Modelling and Visualisation
12.1
Ebola
12.2
Spatial data and models
12.3
Make a Map
12.3.1
Bounding Box
12.4
Grid of points
12.5
Create a Raster of the Temperature
12.6
Dynamics of Disease Transmission
12.6.1
Spatial Proximity with Kriging
12.6.2
Perform Kriging
12.7
Resources
12.7.1
The {sf} package
12.8
Meeting Videos
12.8.1
Cohort 1
13
Advanced Data Visualisation Techniques
13.1
Contour plot
13.2
Pyramid plot
Infectious Diseases
14
Introduction to Infectious Diseases
SLIDE 1
Meeting Videos
Cohort 1
15
COVID-19 Outbreaks
SLIDE 1
Meeting Videos
Cohort 1
16
The Case of Malaria
SLIDE 1
Meeting Videos
Cohort 1
17
Summary: The State of Health
SLIDE 1
Meeting Videos
Cohort 1
Published with bookdown
Health Metrics and the Spread of Infectious Diseases Book Club
10.1 History of Data visualisation
Petroglyphs
Paiute and Shoshone rock painting and carvings depicting lunar cycles and food production
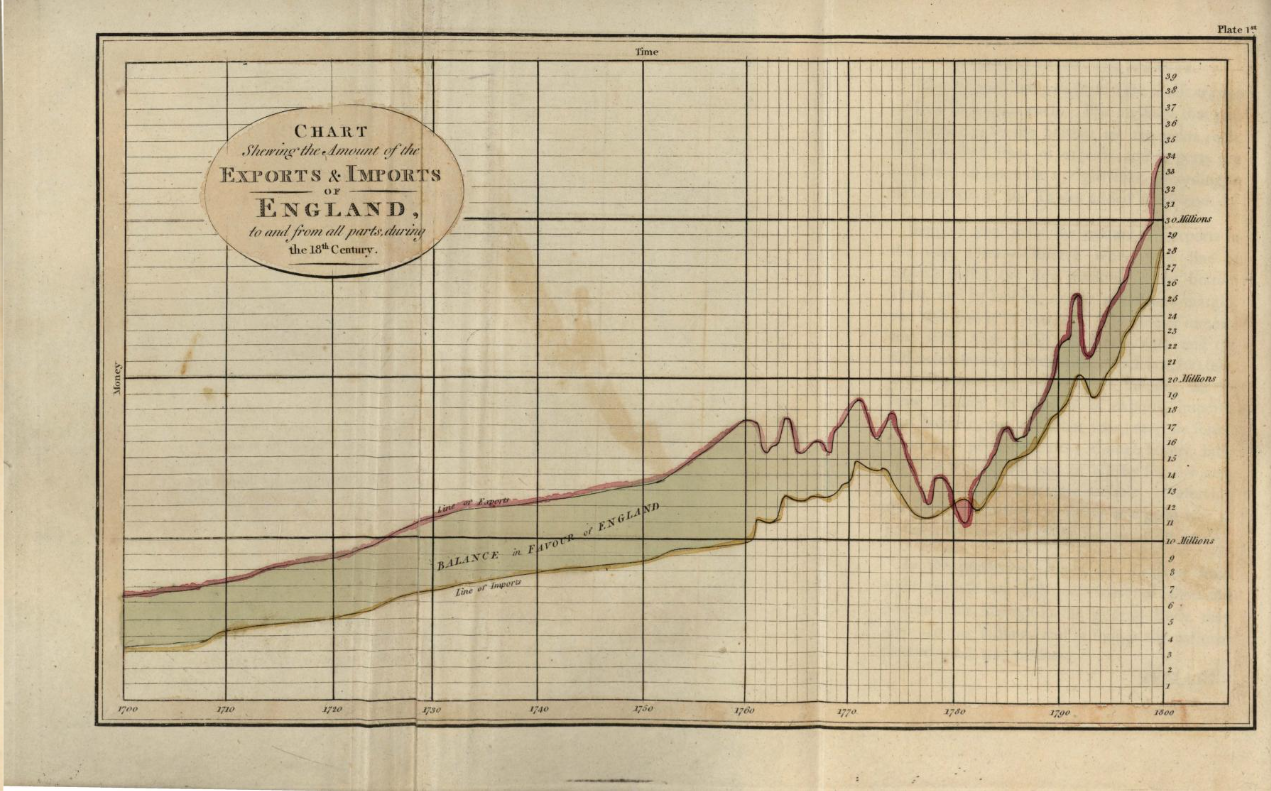
William Playfair
Examples from The Commercial and Political Atlas, 1801.
Early image of a line chart, created by William Playfair.
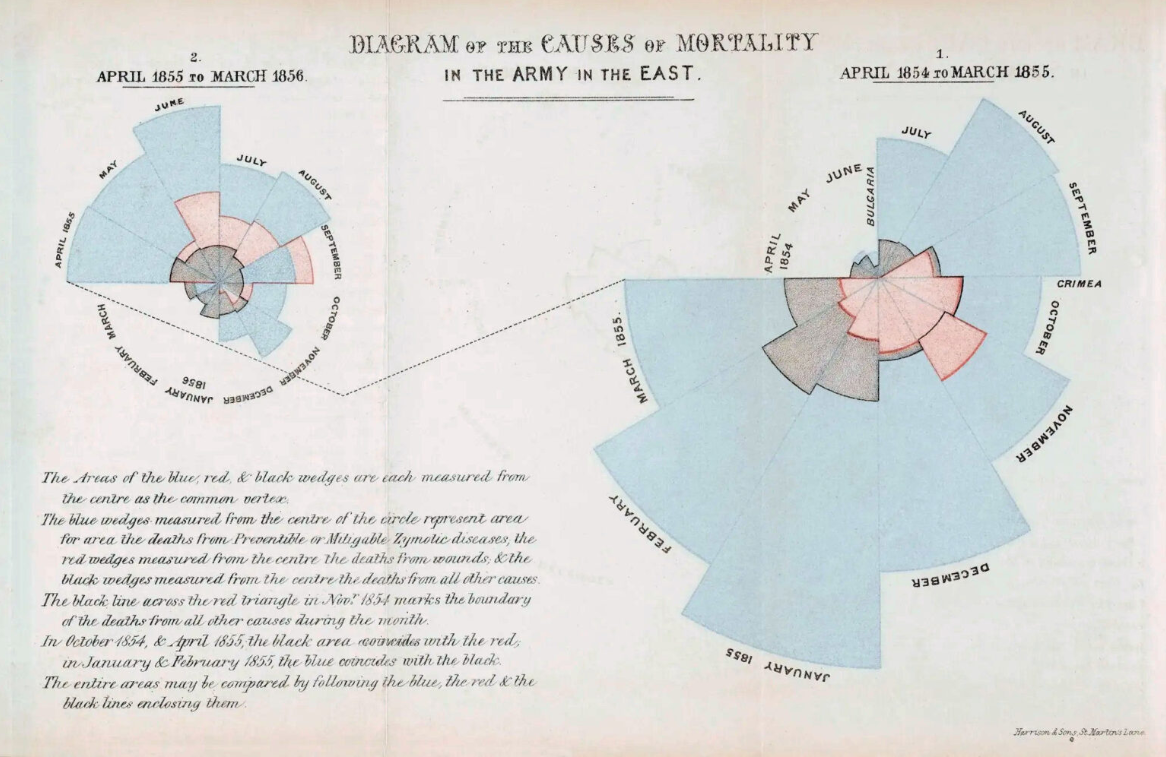
Florence Nightingale
Florence Nightingale’s “rose” diagrams, and other notable women who made significant contributions to data visualisation
Diagram of the Causes of Mortality in the Army of the East, by Florence Nightingale, 1858.
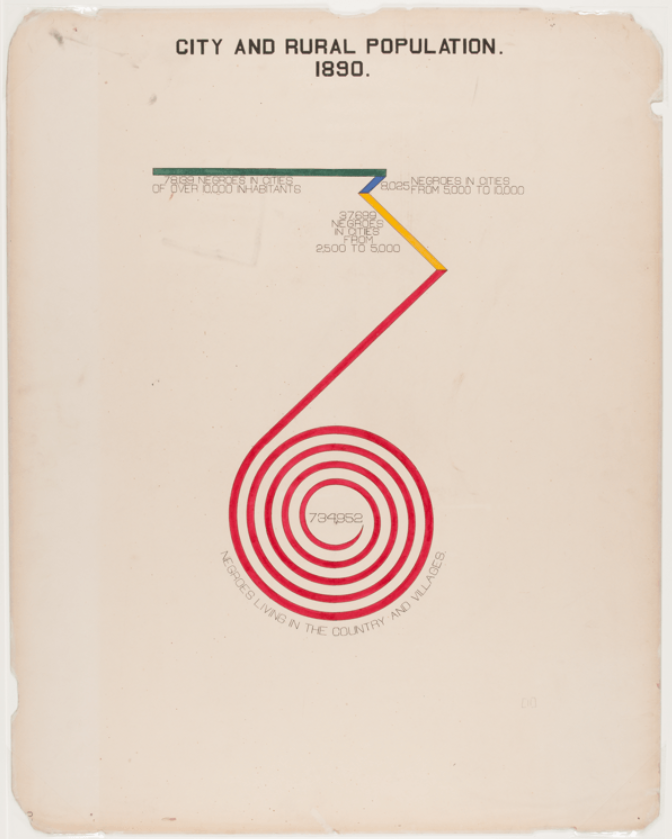
W.E.B Du Bois
Sociologist, author and anti-racist academic who developed many visualisations to challenge harmful stereotypes about Black, African, and African American people.
The “Du Bois Spiral”, created by Black sociologist, W.E.B Du Bois for the 1900 Exposition Universelle in Paris.