10.3 General Guidelines

An effective visualisation is one that:

  1. Presents information clearly without being misleading.

  2. Does not take a lot of effort to interpret.

  3. Uses aesthetics to enhance interpretation, not distract from the facts.

  4. Is not overloaded with information, such as excessive labelling.

  5. Is accessible (including alternative formats).
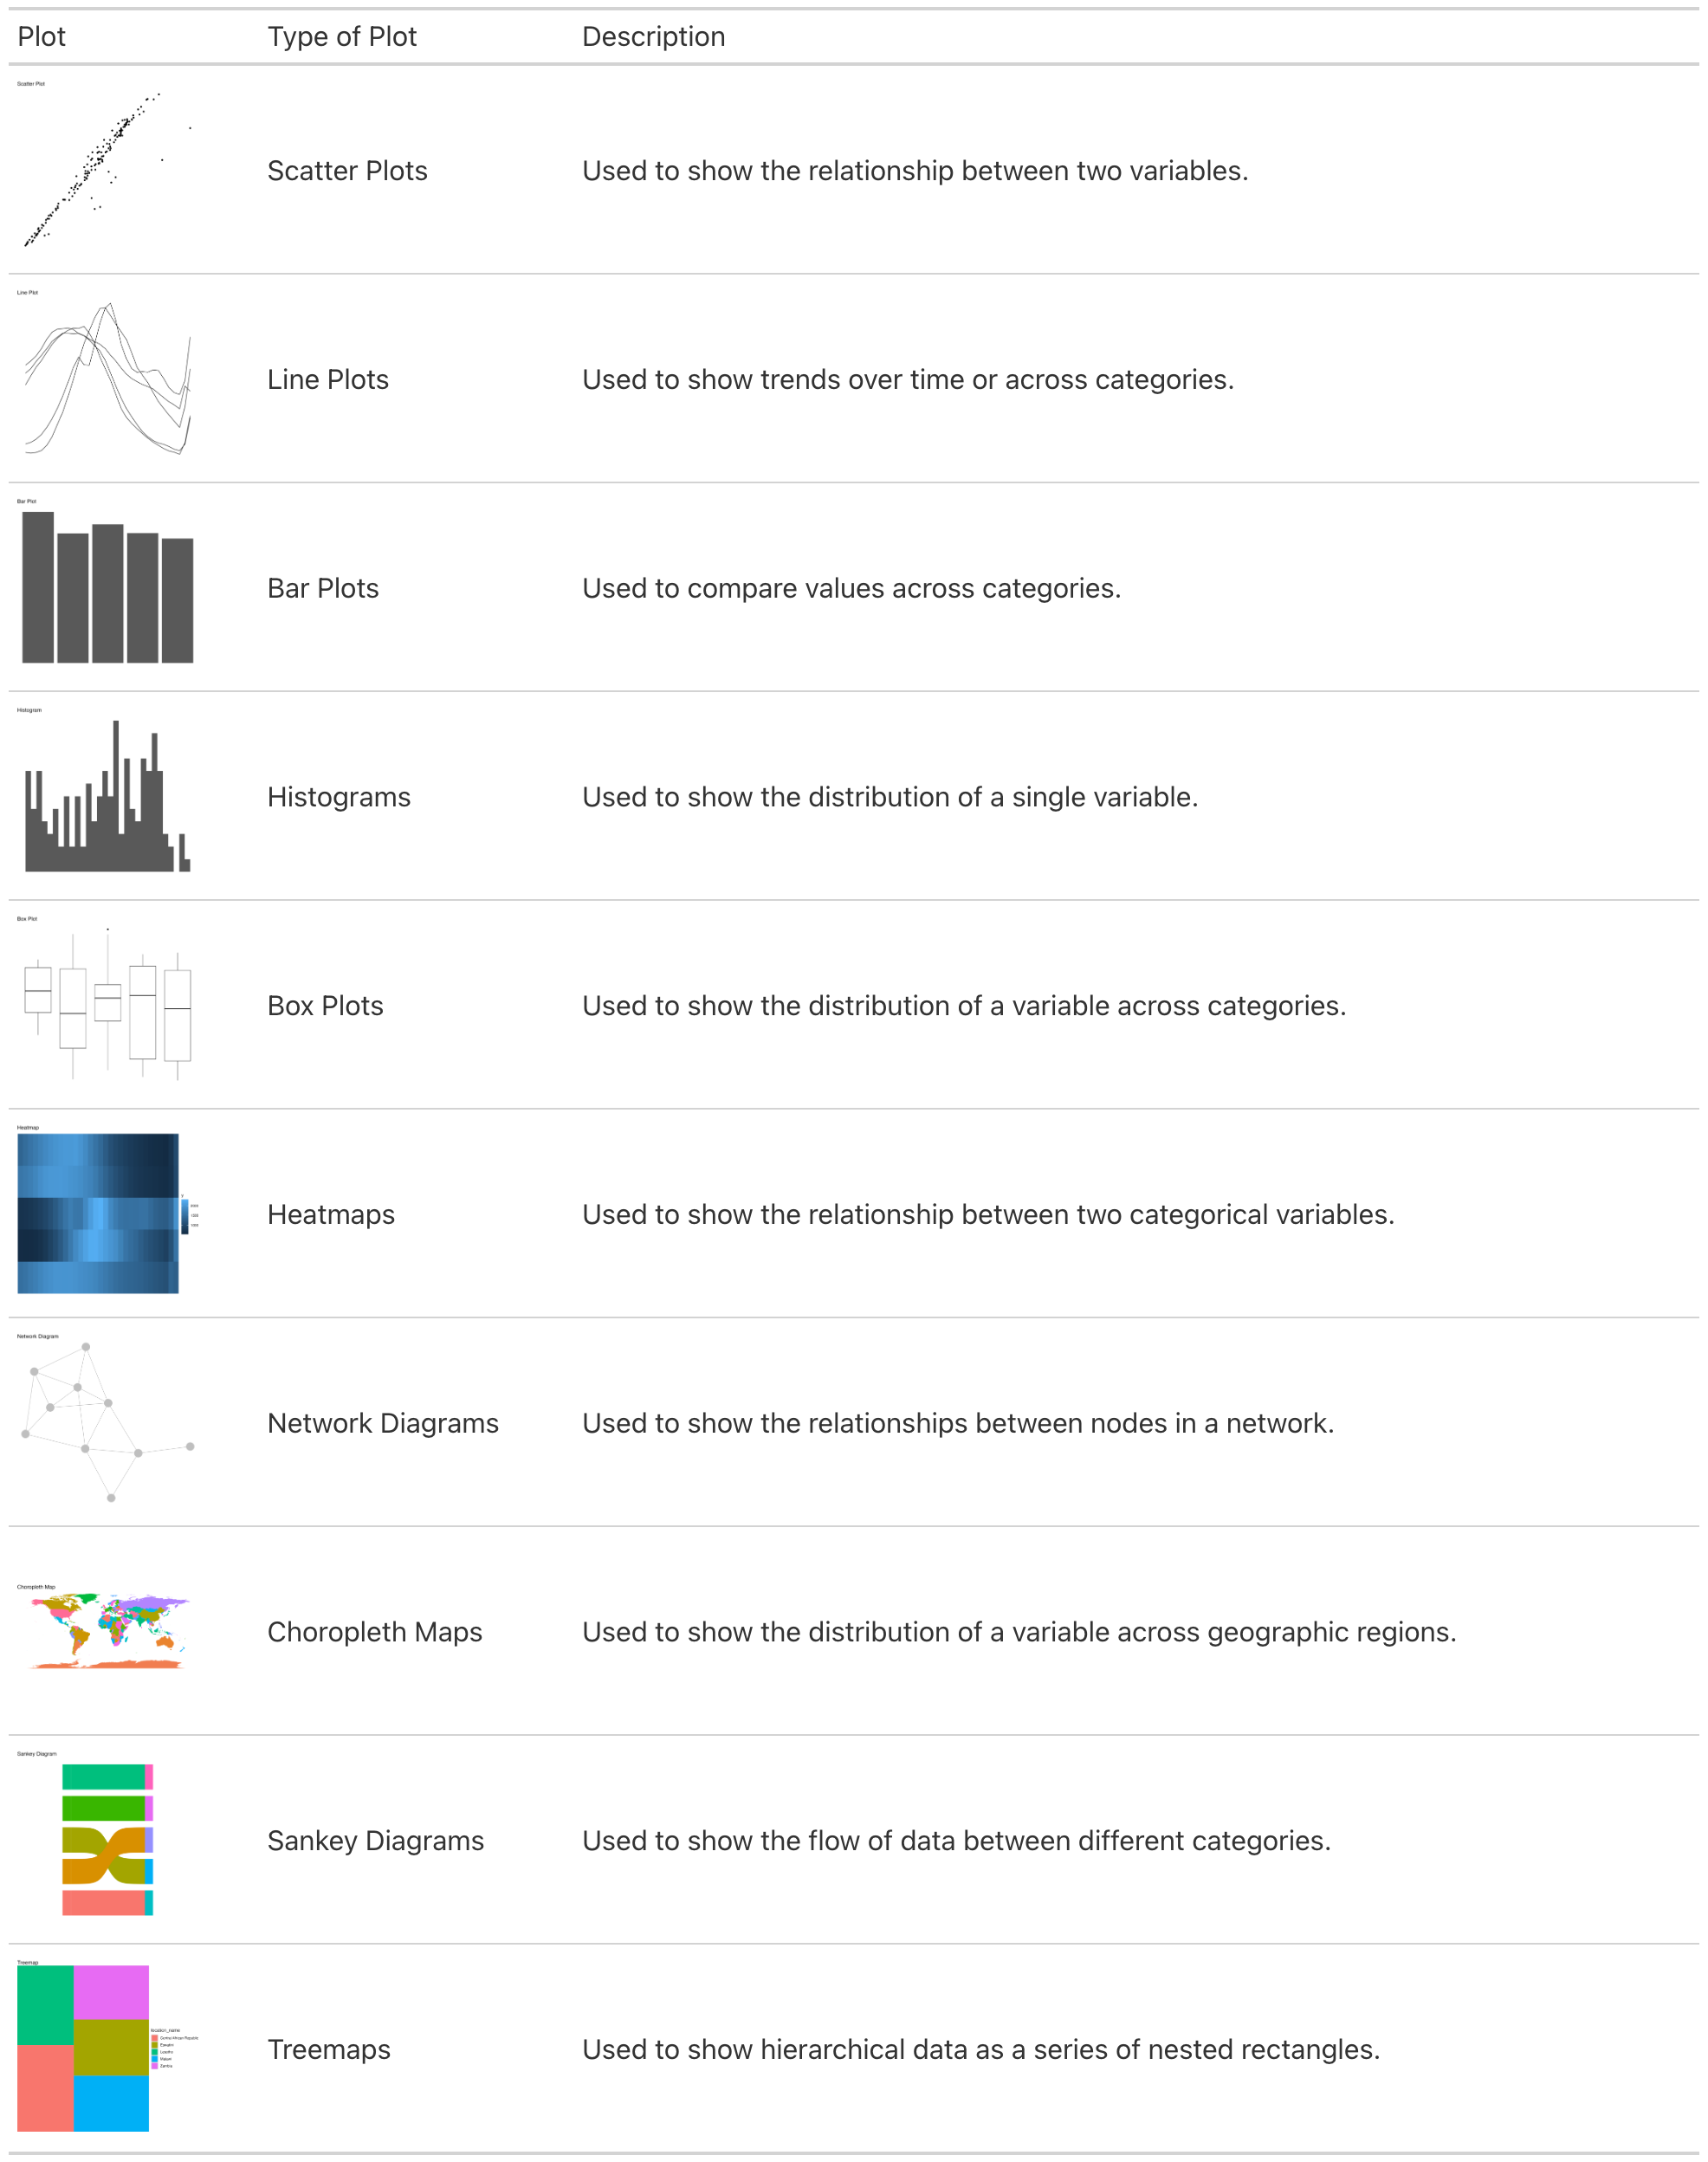
Common types of plots and their uses

Table of different chart types. The first column shows an example of each chart. The second column provides the name of the chart type. The third column provides a use case for the chart. The chart types are: scatter plot, line plot, bar plot, histogram, box plot, heatmaps, network diagrams, choropleth maps, sankey diagrams, treemaps.