Communicating Results
- Some models conducive to clear visualisation, e.g. decision-tree model can be ploted with {rpart.plot}
- This sets out the fitted algorithmic choices and their effect on the predicted outputs
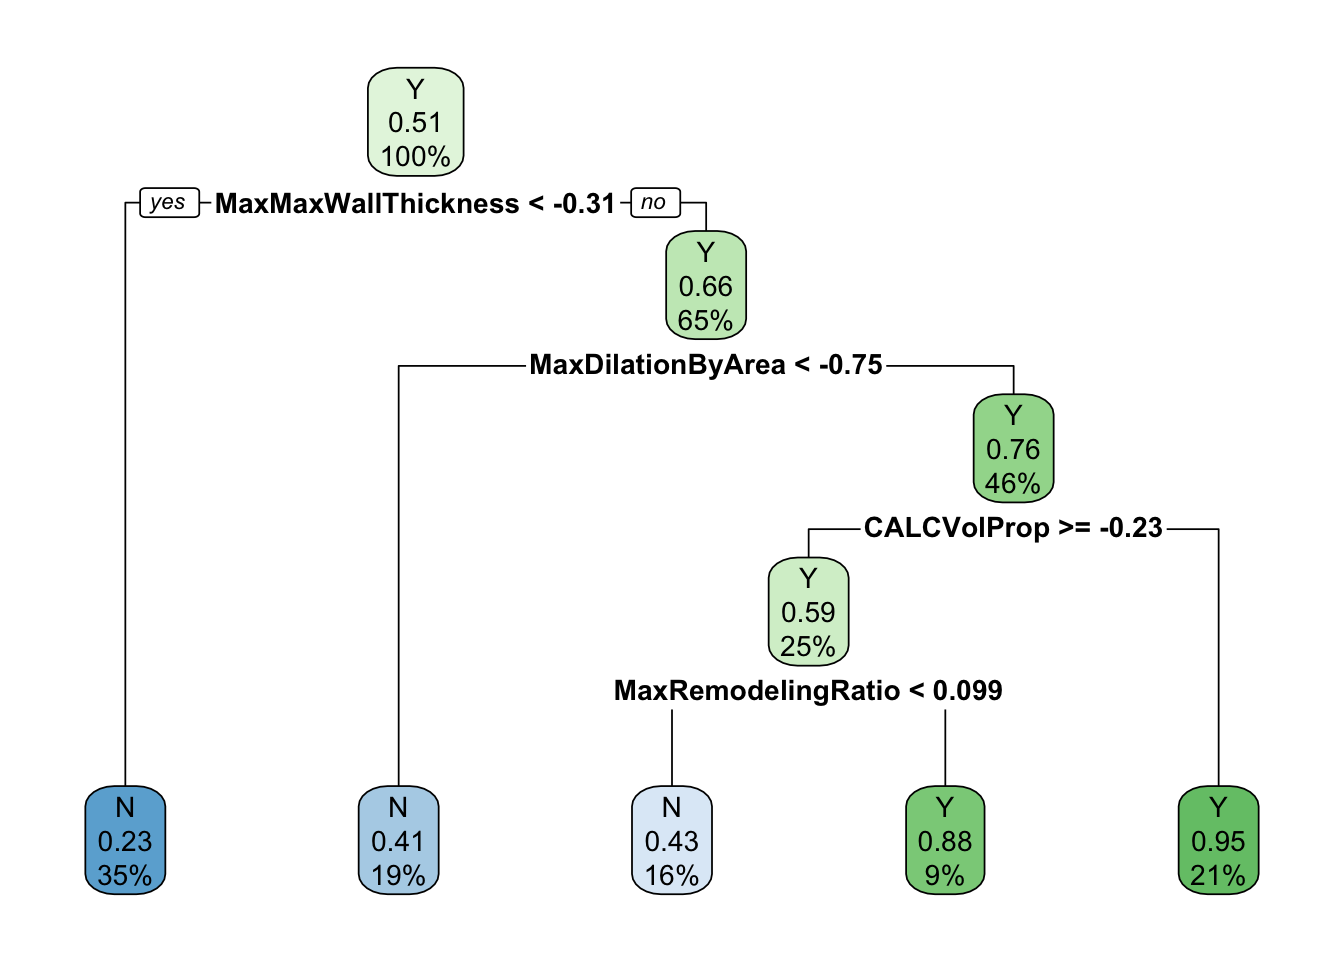
Fig 11.8: Decision tree for Ischaemic Stroke
- Random forests can show variable importance plots
- These show the ranked importance of each predictive element
- Low ranking elements can be dropped if little effect on the model
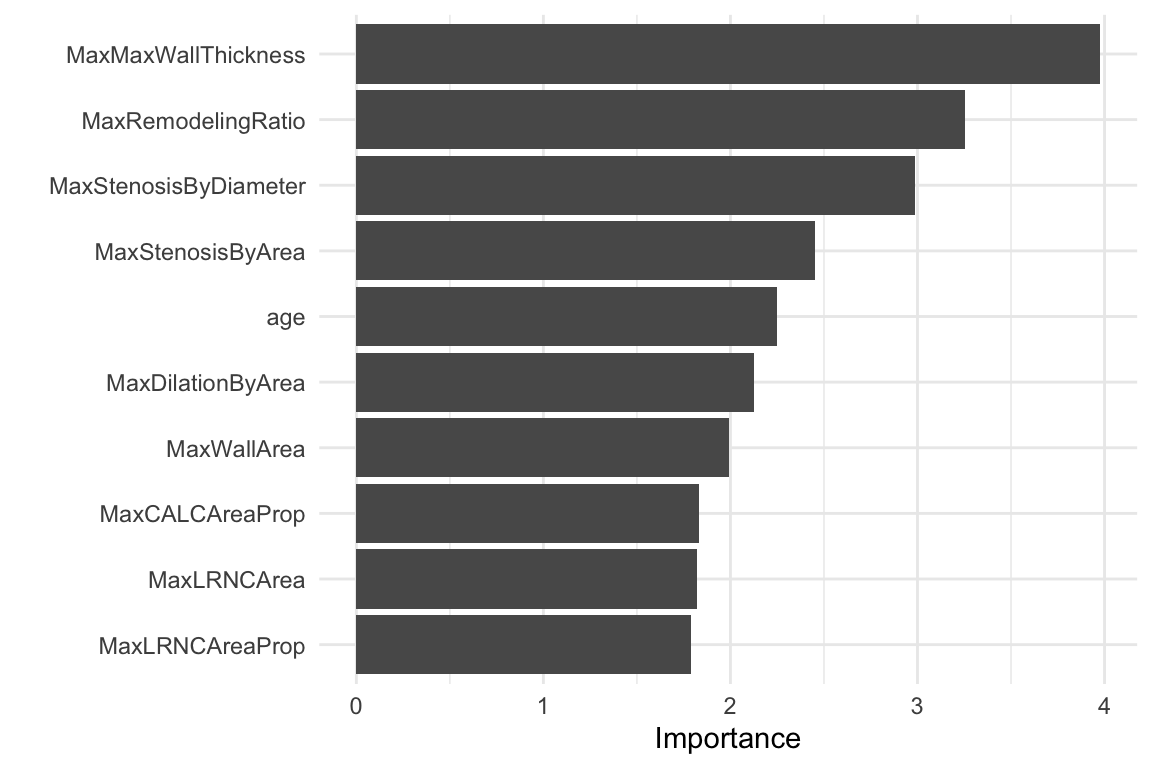
Fig 11.9: Variable Importance for Ischaemic Stroke
- Neither visualisation makes a causal claim, but can often give clues to make inferences.