Partial Independence Plots
- Plot how prediction / output changes with changes in one input
- Assuming other variables held constant (typically at average for the dataset)
- Can show marginal effects or key thresholds as the value of the input changes
- Need to be aware that assuming other variables don’t change may not be realistic -
- inputs may be correlated
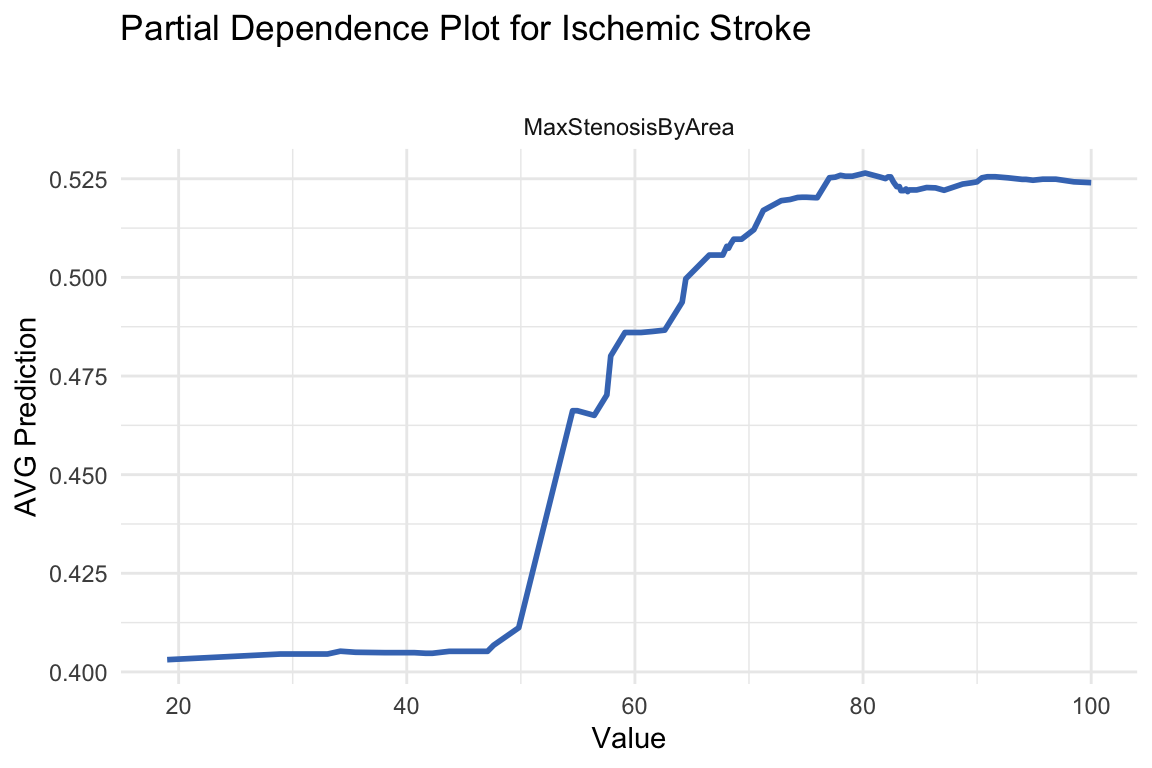
Figure 11.11: Partial Dependence Plot