6.3.2.2 Random Forest
Using machine learning to calibrate the model.
Random forest models:
Use ensemble learning to build multiple decision trees.
Combine predictions to improve accuracy and reduce variance.
Are used for classification and regression.
A nice graphical description of the random forest algorithm - in Python.
R package {randomForest} is used to predict the number of new infections and train the model.
Step 1: Add some ‘noise’ to the simulated data.
simulated_data <- cbind(simulated_data,
                        noise = rnorm(nrow(simulated_data),
                                      mean = 0,
                                      sd = 5))

head(simulated_data)
## time S E I R noise
## 1 0 999.0000 1.0000000 0.00000000 0.000000000 -0.7706198
## 2 1 998.9857 0.9186614 0.09324728 0.002384628 -0.6791912
## 3 2 998.9452 0.8699953 0.17567358 0.009145043 9.5844350
## 4 3 998.8812 0.8483181 0.25070051 0.019828923 0.7868484
## 5 4 998.7954 0.8493639 0.32110087 0.034138118 -7.8705876
## 6 5 998.6890 0.8699856 0.38915443 0.051899977 9.3768045Step 2: Split data into training and testing sets (assess predictive performance).
# Load required packages
library(randomForest)

# Split the data into training and testing sets
set.seed(123) # This makes the process reproducible

train_index <- sample(nrow(simulated_data),
                      0.8 * nrow(simulated_data))
train_data <- simulated_data[train_index, ] # 80 observations
test_data <- simulated_data[-train_index, ] # 21 observations

# Train the Random Forest model - non machine learning yet!
rf_model <- randomForest(
  formula = I ~ .,
  data = round(train_data)
)
The number of infections is the response variable.
Step 3: Predicting new infections.
Use the predict() function on the test data.
# Make predictions on the test set
predictions <- predict(rf_model, newdata = test_data)
# Calculate Root Mean Squared Error (RMSE)
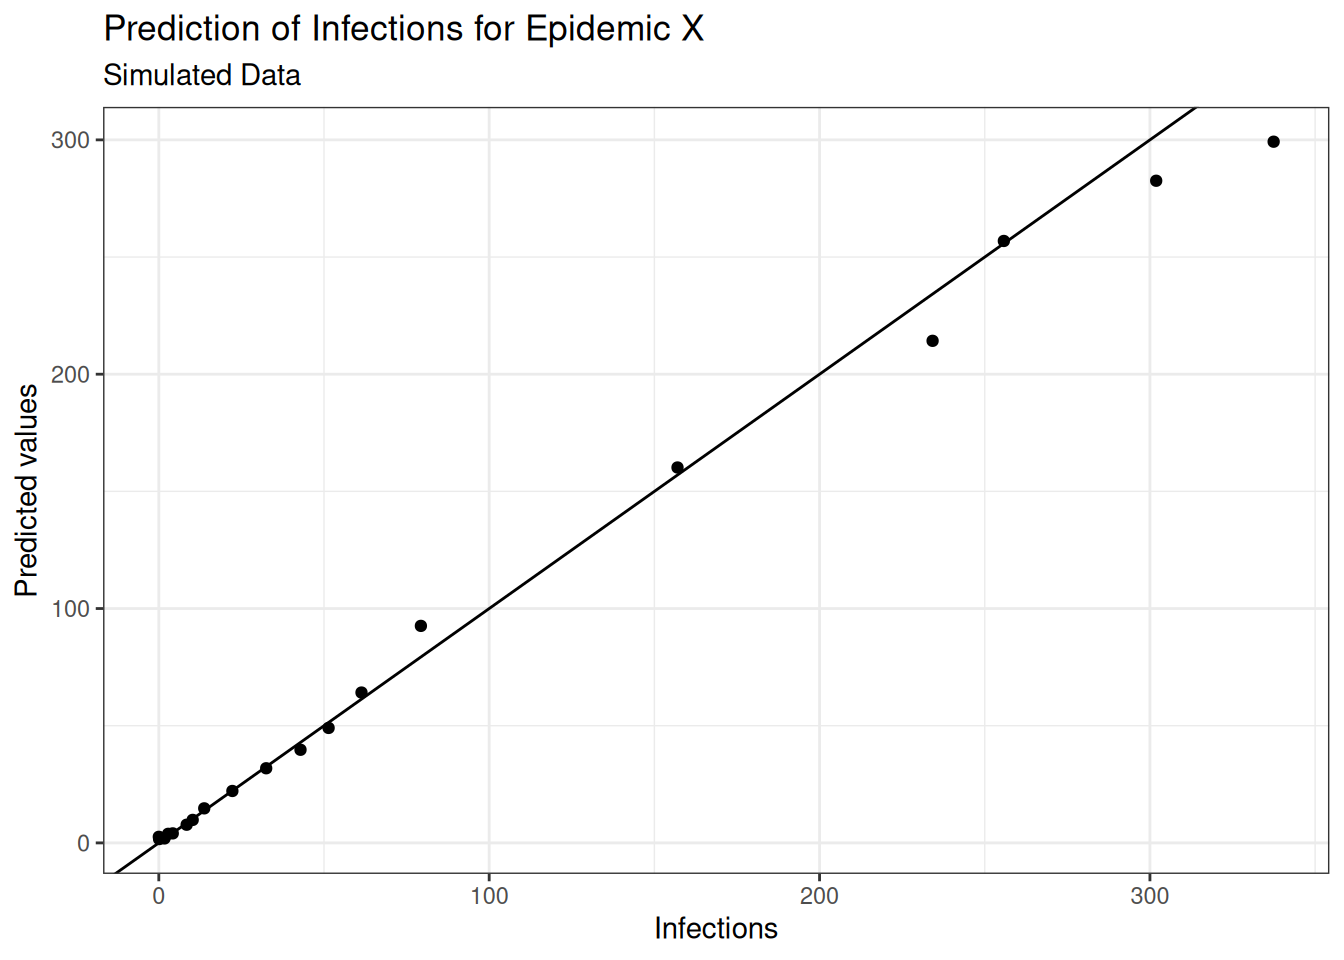
(rmse <- sqrt(mean((test_data$I - predictions)^2, na.rm = T)))## [1] 10.82519The Root Mean Squared Error quantifies how much the predicted values deviate from the actual values (smaller is better).
The model’s predictions deviate from the actual values by an average of 10.83 new infections.
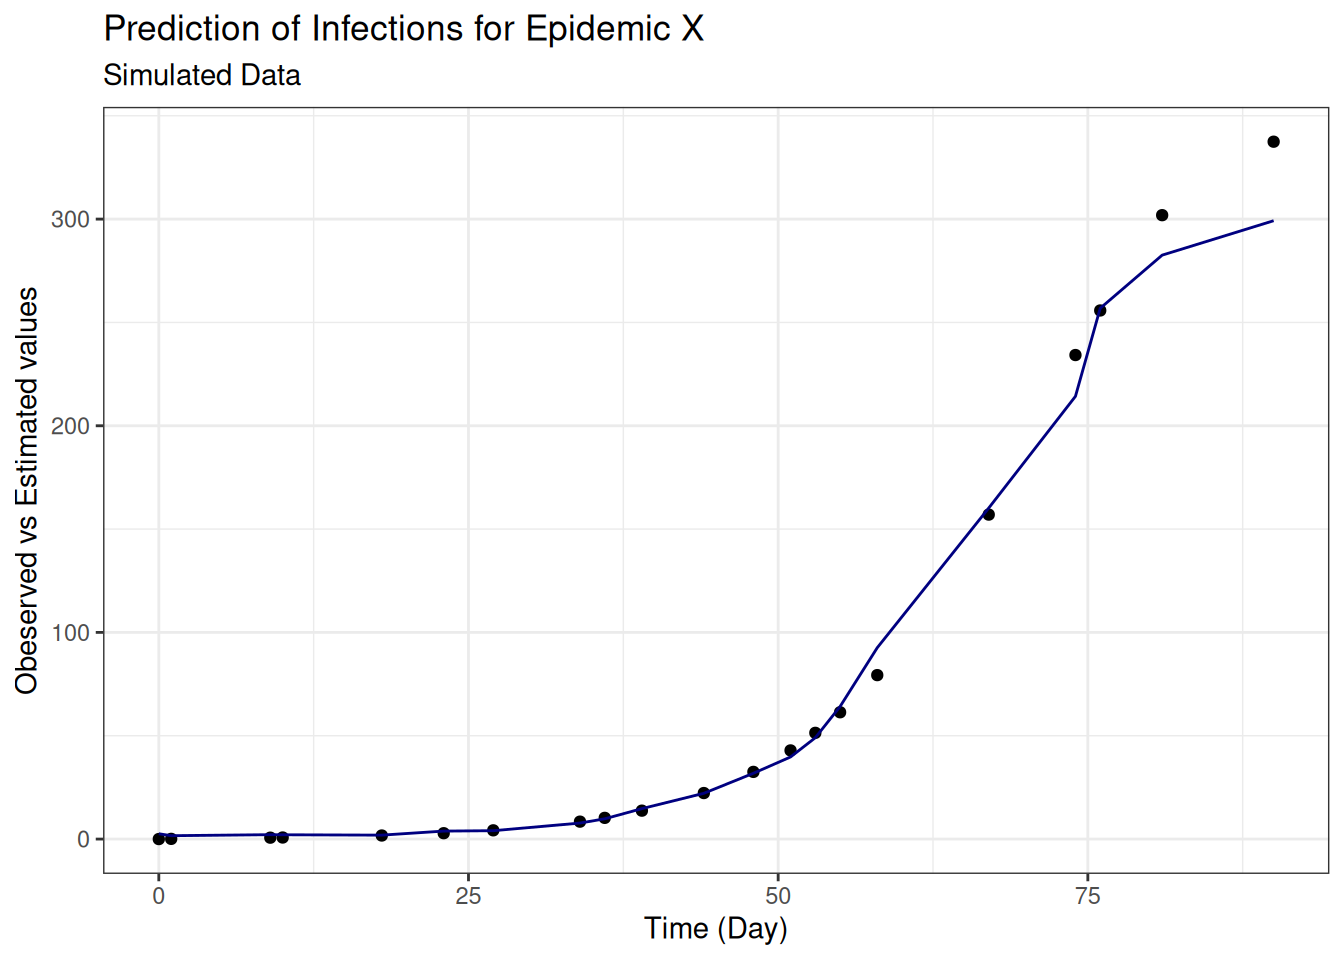
Plots of infection numbers against predicted values, and observed vs estimated values against day, show some improvement in the fit: