Influential Observations
- High-Leverage Point: An observation with extreme values (far from the average input/output)
- These points pull linear model fit disproportionately (can change slope/coefficients)
- High leverage + large residual = Influential outlier (can skew model)
- Can use diagnostics like Cook’s Distance (in stats package) to identify influential points
- Investigate high-leverage cases and consider fixes if needed
library(RColorBrewer)

data_pred |>
  mutate(cook_over_1 = cooks.distance(mod3) > 1) |>
  ggplot(aes(Deaths, Residuals, colour = cook_over_1)) +
  geom_point() +
  geom_hline(yintercept = 0, color = "red") +
  scale_colour_manual(values = brewer.pal(3, "Set1")[1:2],
                      labels = c("Cook's D ≤ 1", "Cook's D > 1"),
                      name = "Influence") +
  labs(title = "Residuals vs. Deaths due to COVID-19",
       x = "Deaths", y = "Residuals")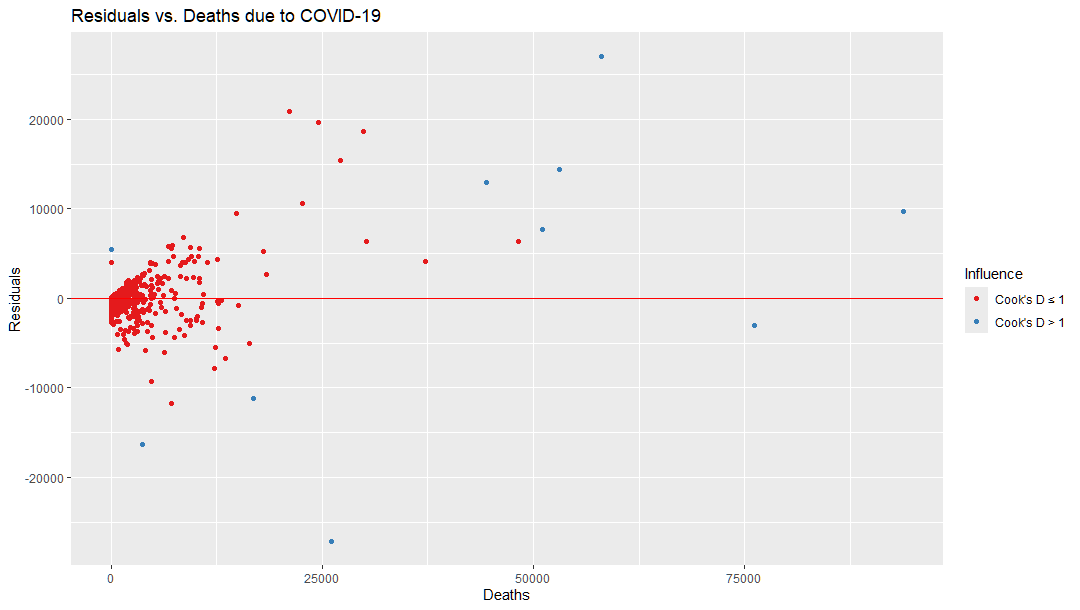
Points where Cook’s Distance > 1