Residual Plots
- Residual = Actual – Predicted: measures error for each prediction
- Residual Plot: residuals on y-axis vs. predicted value or input on x axis
- Ideal outcome: Residuals normally distributed around 0 (no pattern)
- A pattern in residuals indicates model misspecification (e.g. curve suggests missing non-linear term)
- Heteroskedasticity: Residuals get bigger with x axis (fan shape), error variance isn’t constant and std errors may be wrong
- Can identify outliers: Large residuals may indicate points that distort or need investigating
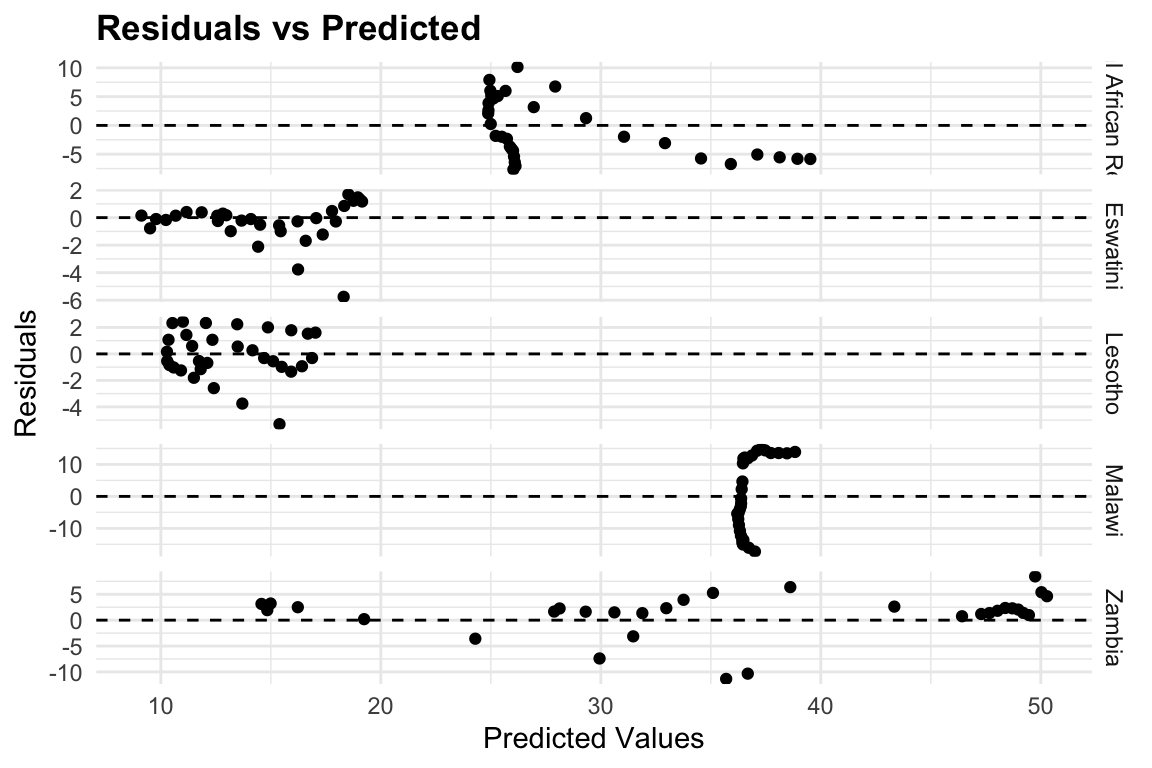
Figure 11.6