1.7 Visualising reactive expressions
The flow visualised in 2.1 now has a middle layer - a reactive expression.
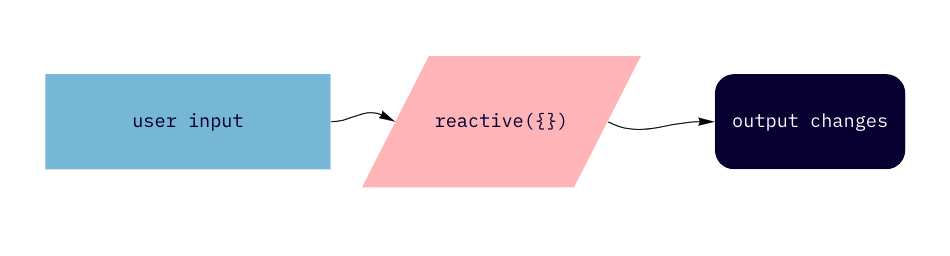
Which lives in the server function of the app. The ui to server connections can be visualised like this: 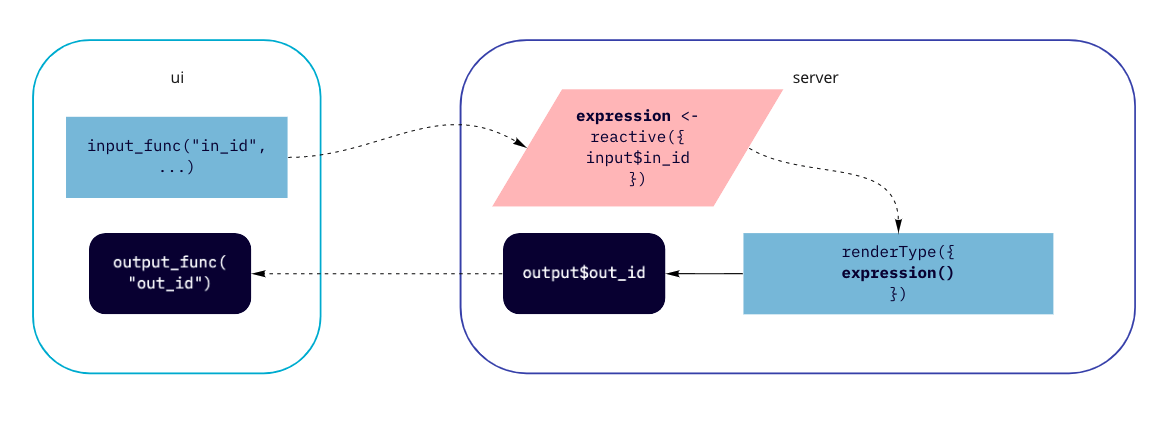
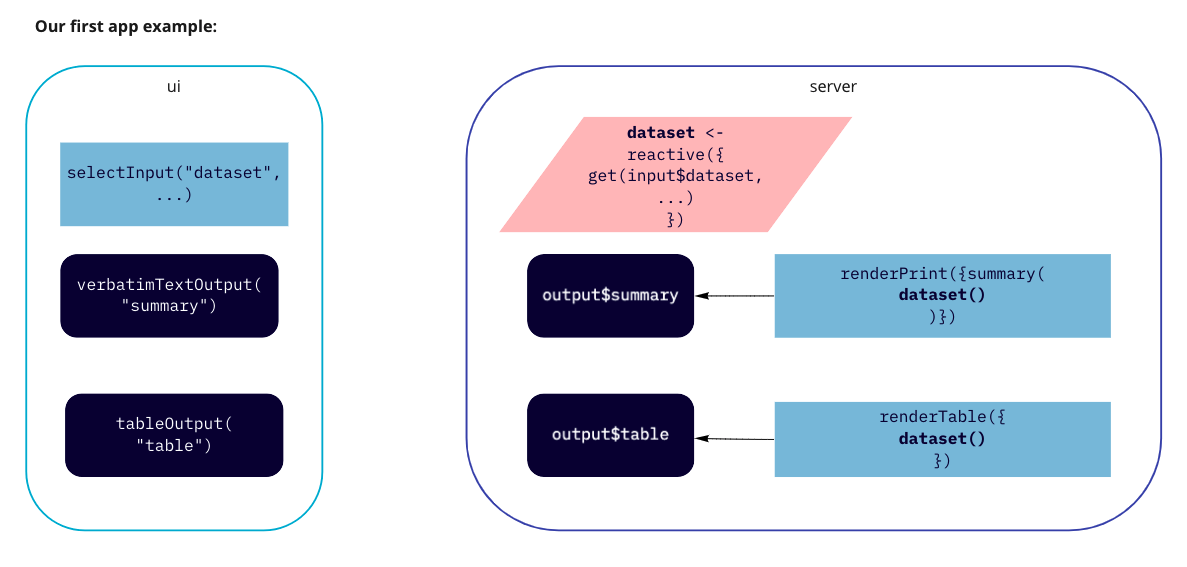
Using our ‘first app’ as an example:
A good way to see this in action is to use Shiny’s showcase mode:
You can read more about the different Shiny display modes here.