Visualizing the uncertainty of point estimates
- Let’s review a few key concepts.
- In statistics we work with samples drawn from a population.
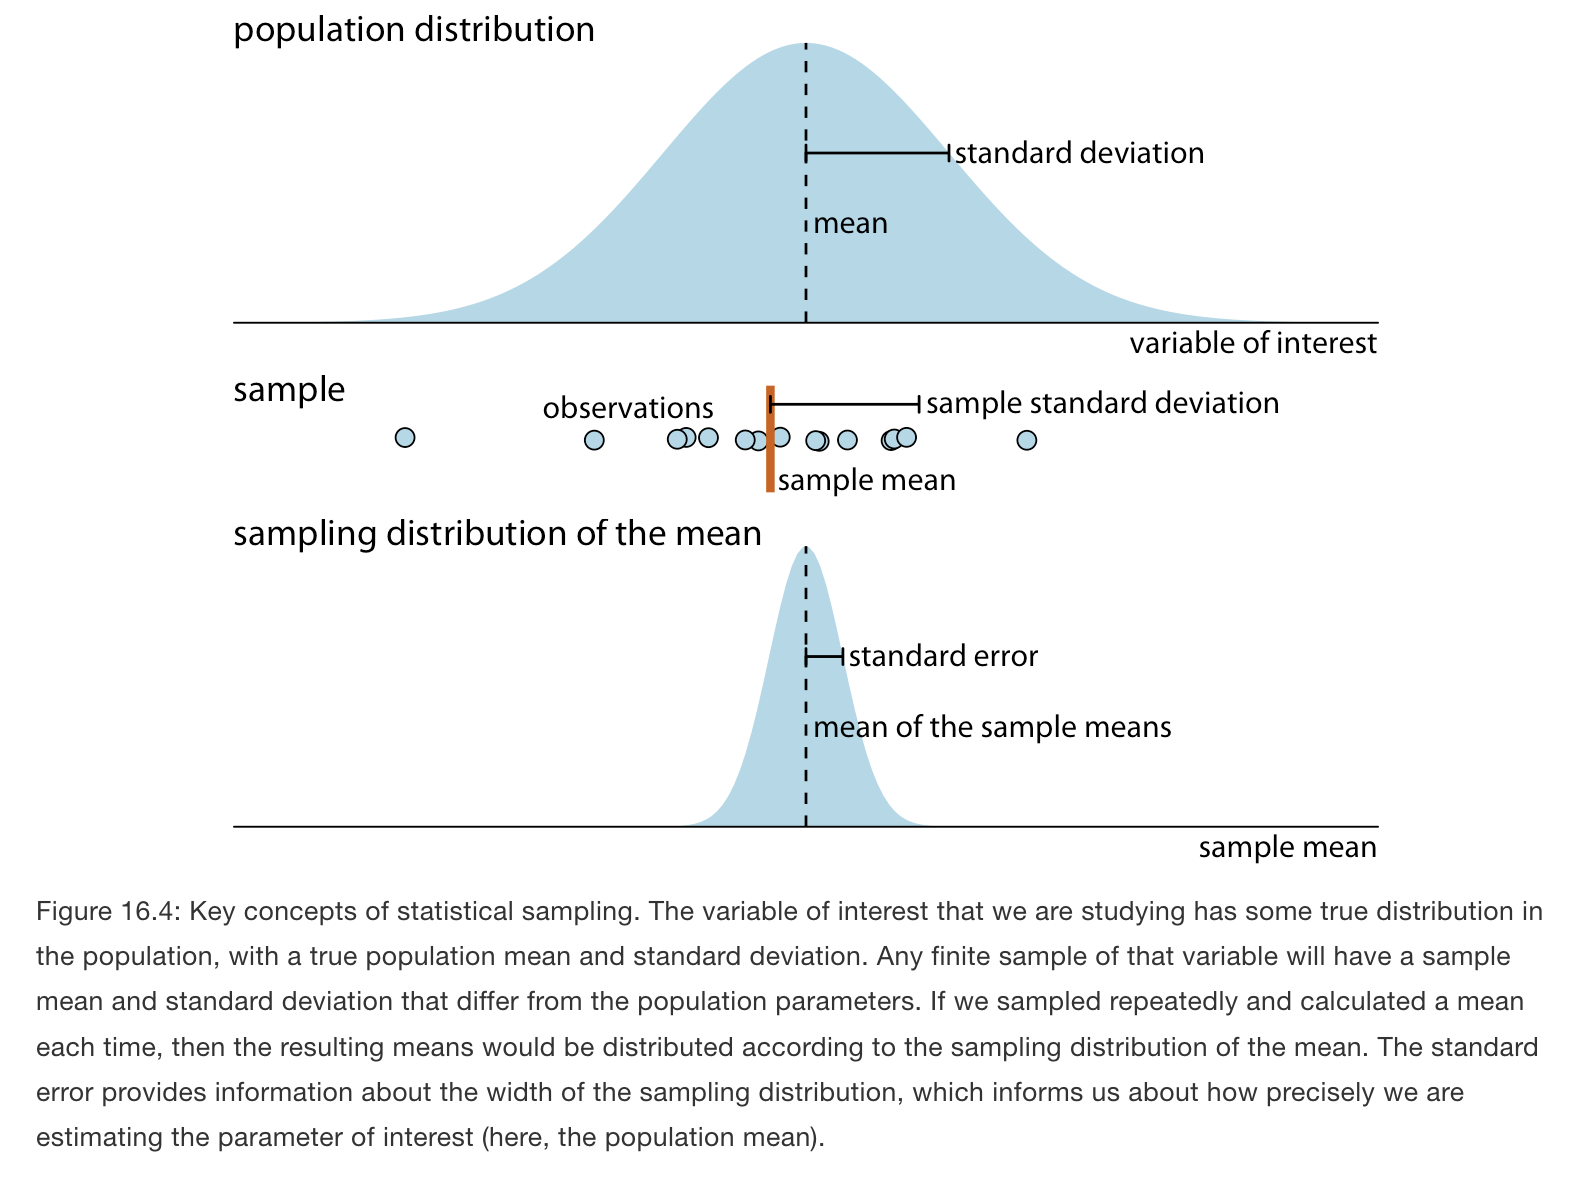
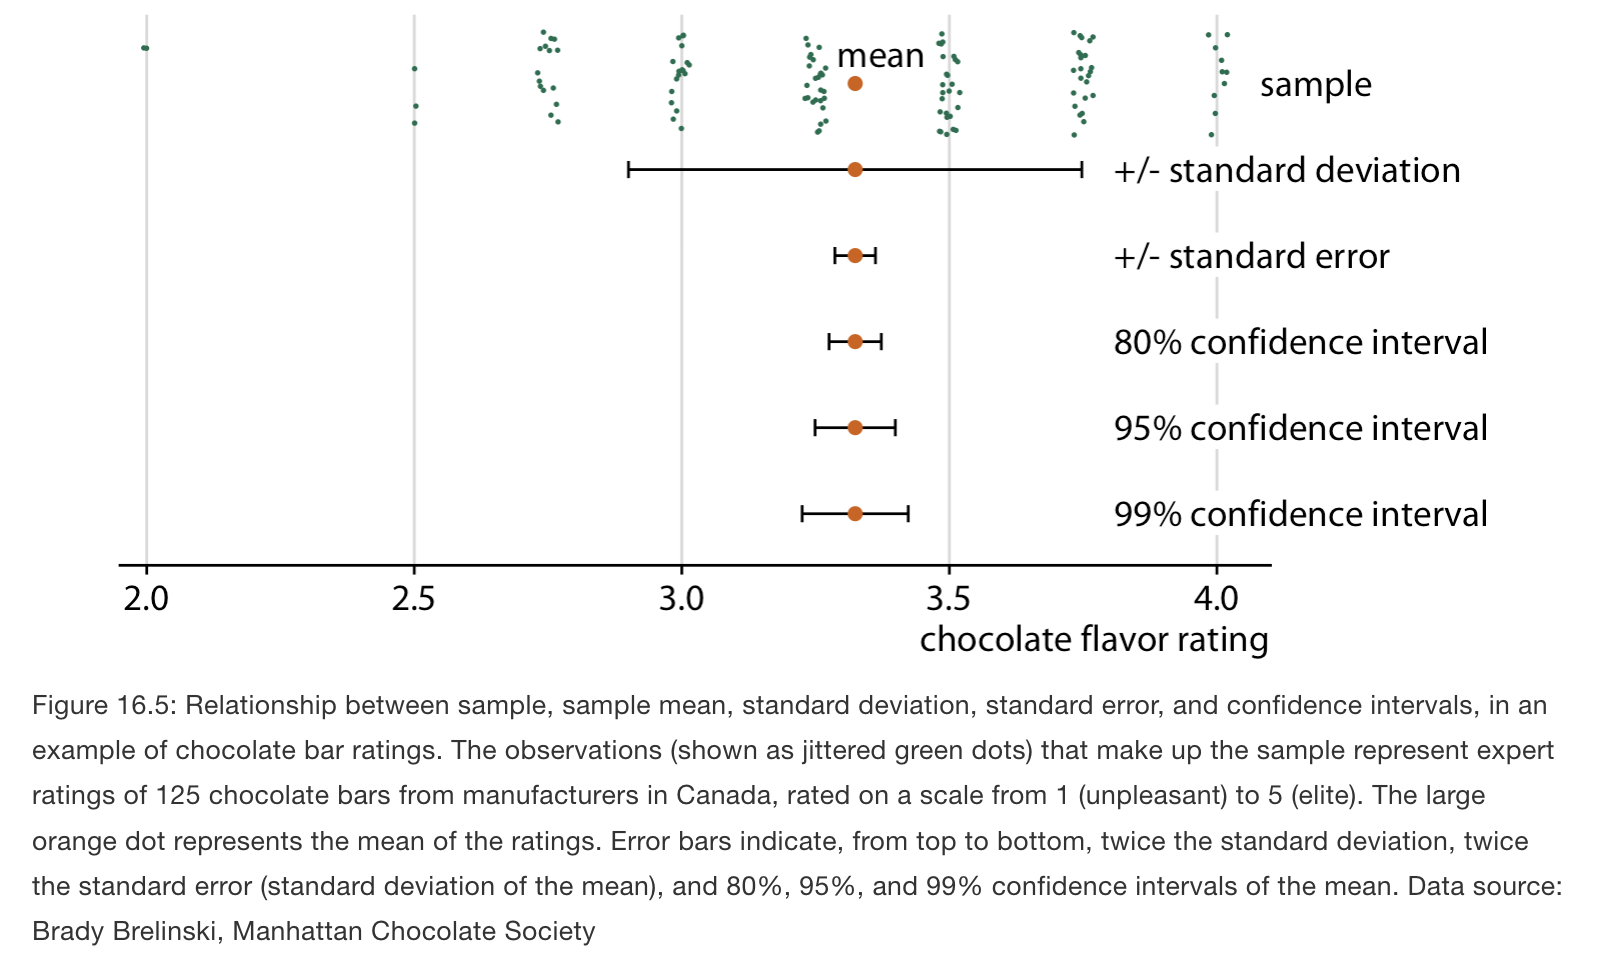
- Let’s review the differences between the standard deviation and the standard error. The standard deviation is a property of the population. It tells us how much spread there is among individual observations we could make. By contrast, the standard error tells us how precisely we have determined a parameter estimate.
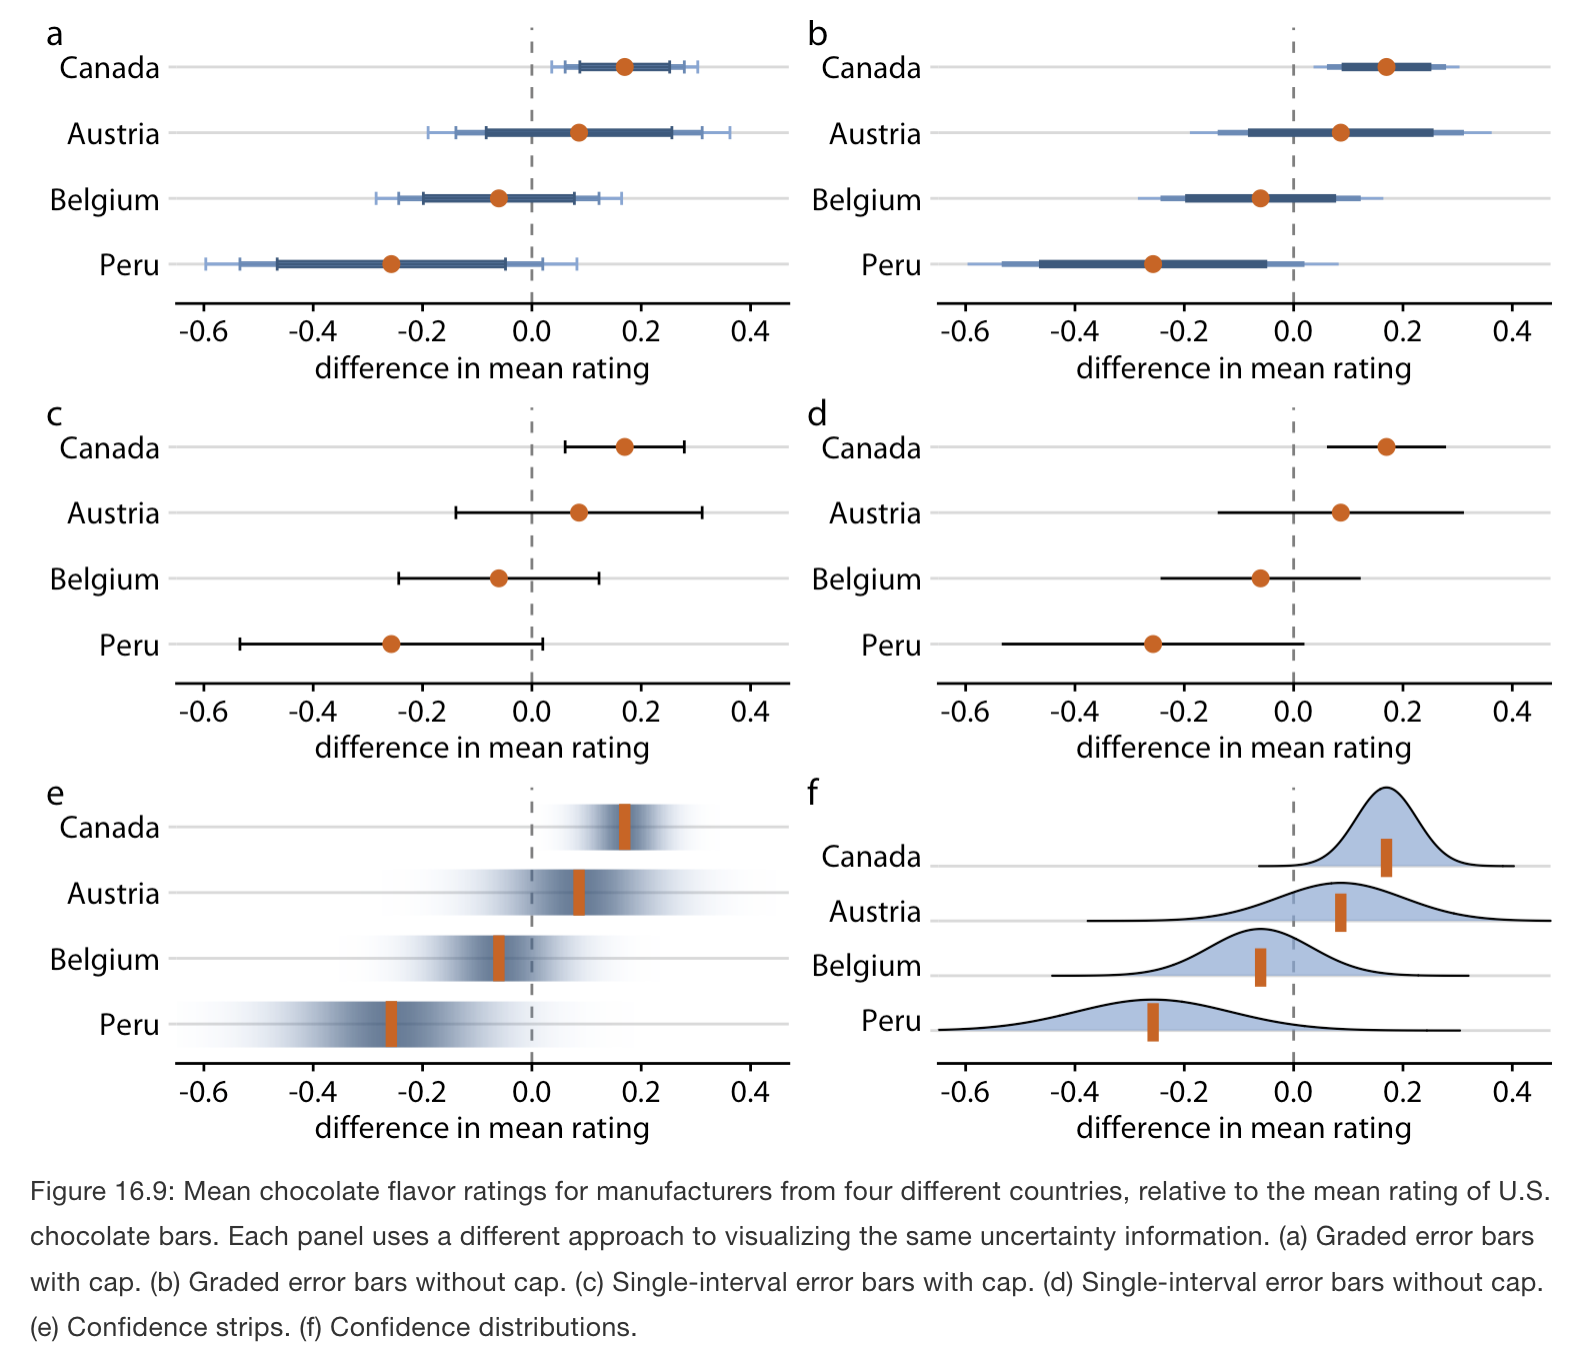
- Frequentists most commonly visualize uncertainty with error bars.
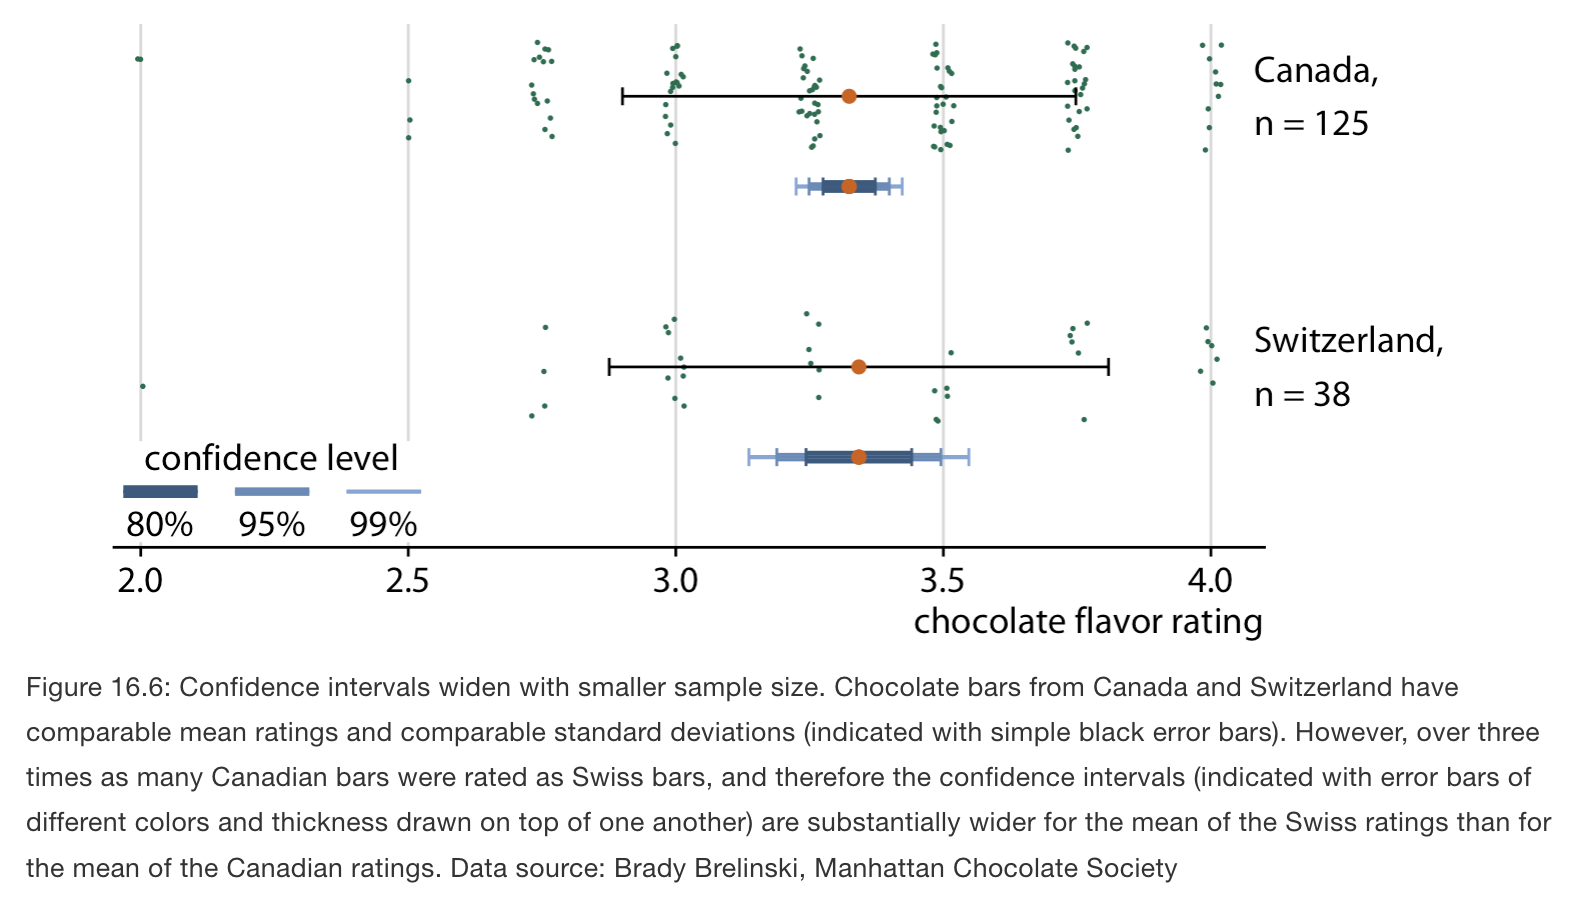
- A confidence interval is a range of values, calculated from sample data, that has a certain probability of containing the true value of the population parameter being estimated.