How to properly represent visualizations along linear axes
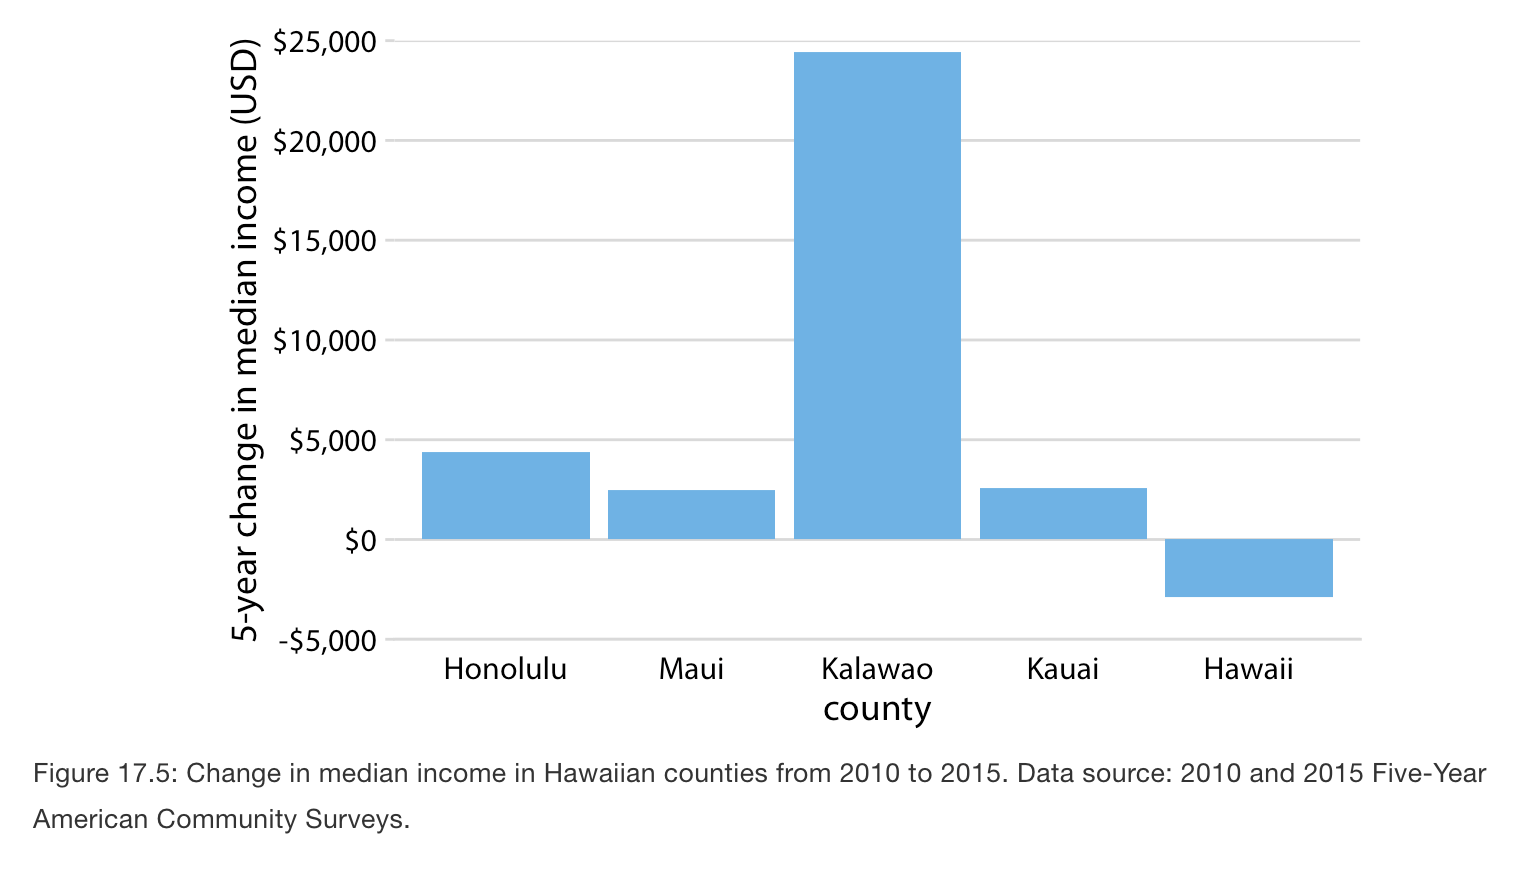
- To represent small changes over time or differences between conditions, then consider showing the change in median income in Hawaiian counties from 2010 to 2015.
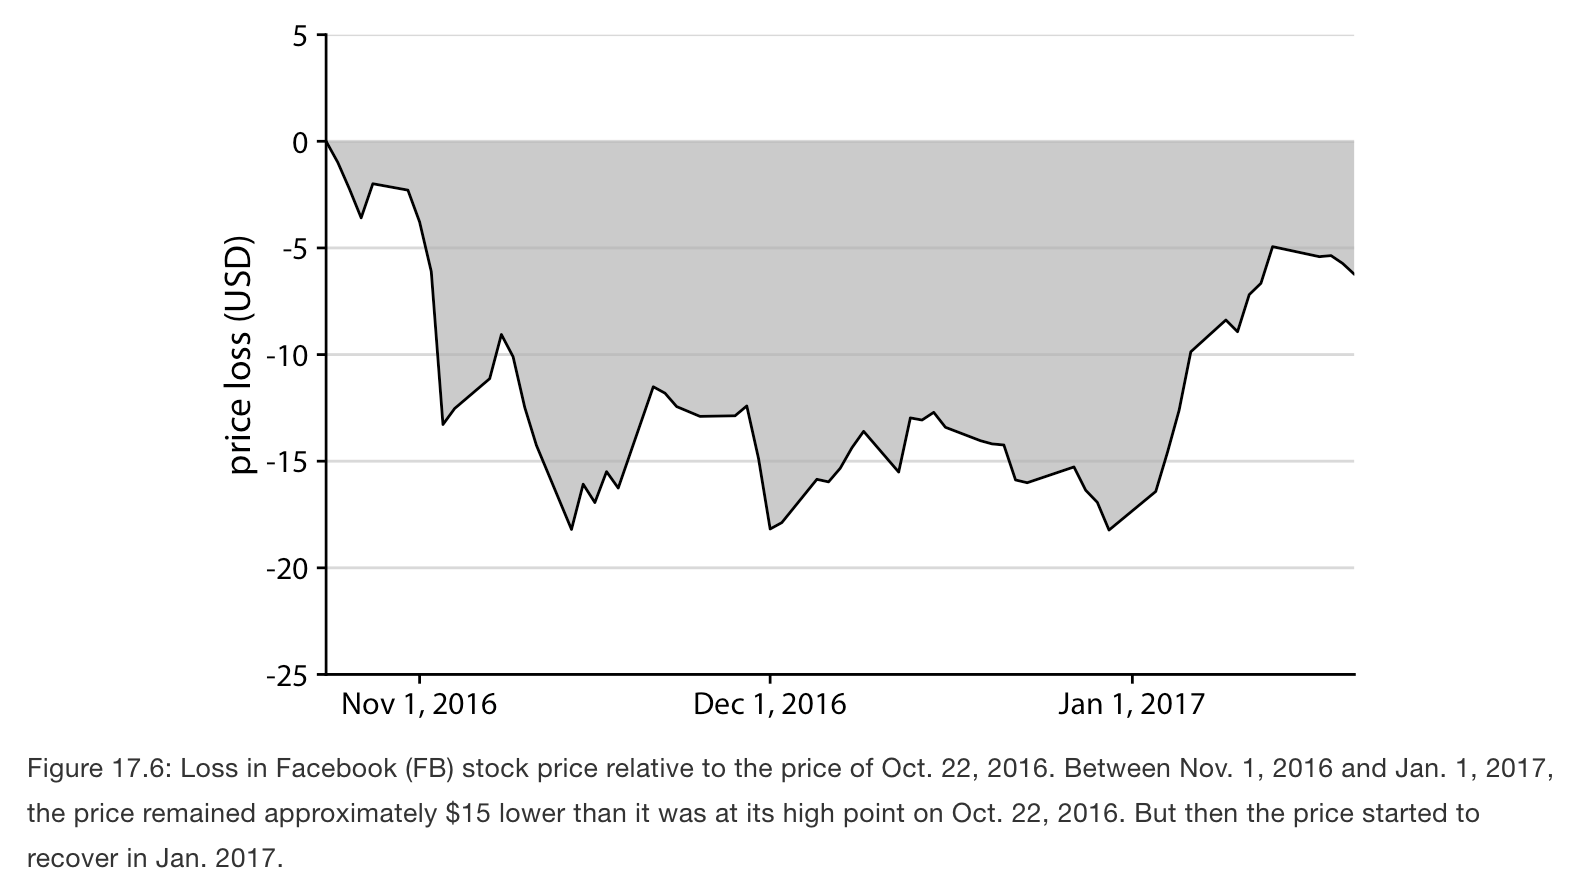
- Similarly, we could shos the change in Facebook stock price over time as the difference from its temporary high point on Oct 22 2016. The shaded area now represents the distance from the high point.