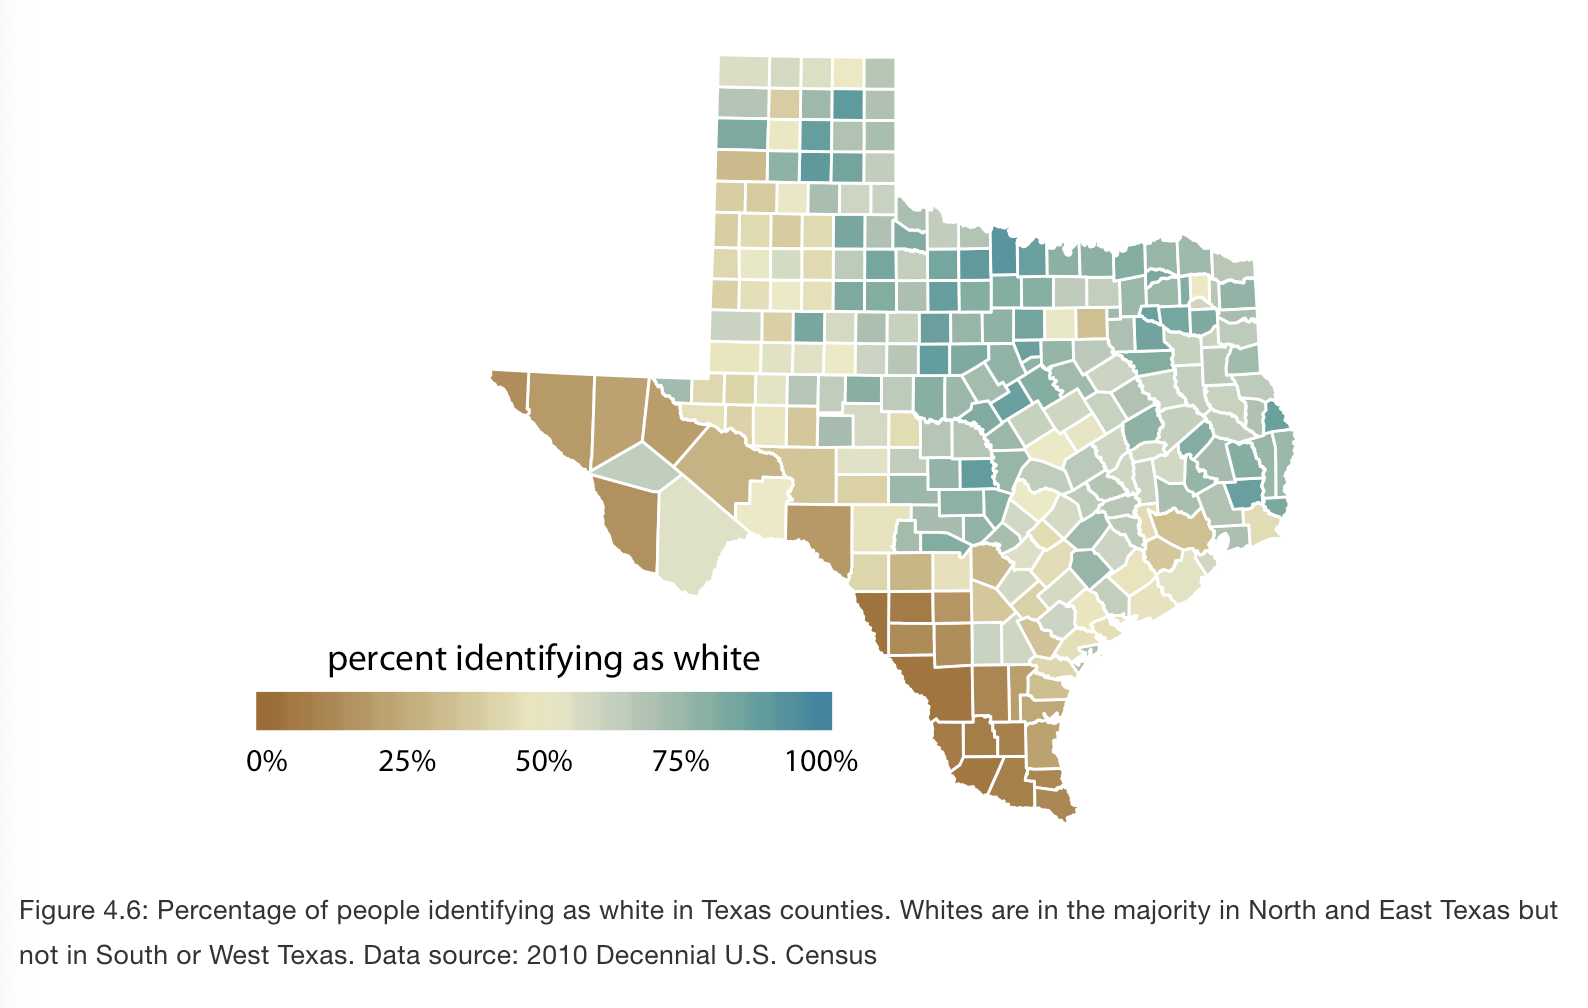
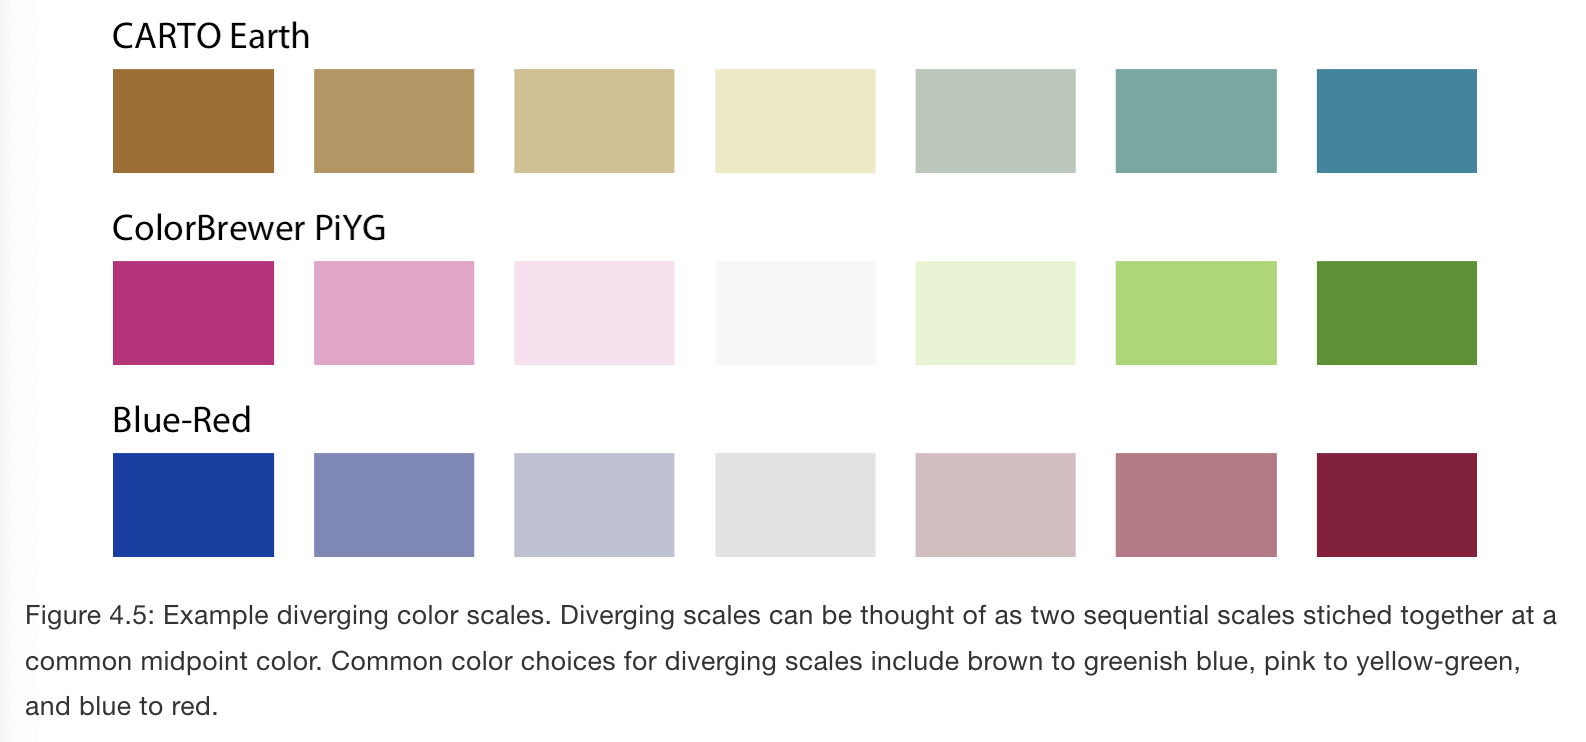
Diverging Color Scales: midpoints
- two sequential scales stitched together at a common midpoint (light color)
- visualize deviation of data values in one of two directions relative to a neutral midpoint. Eg. positive and negative values.
- balanced to indicate progression of colors in either direction is the same. Magnitude on either direction is the same.
Example: Percentage of people identifying as white in Texas counties. - 50% is a meaningful midpoint value