Small multiples
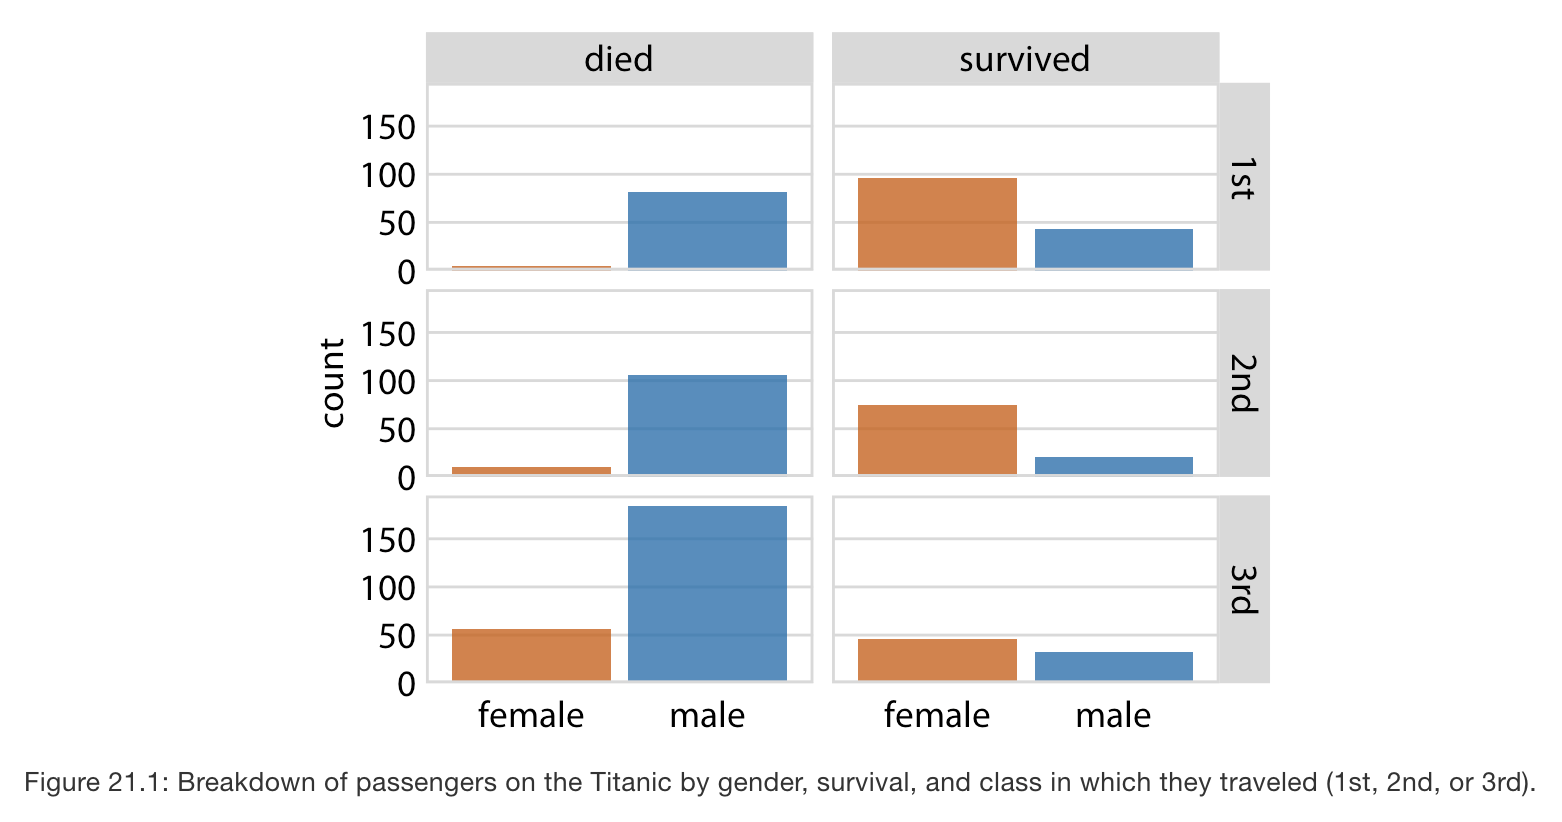
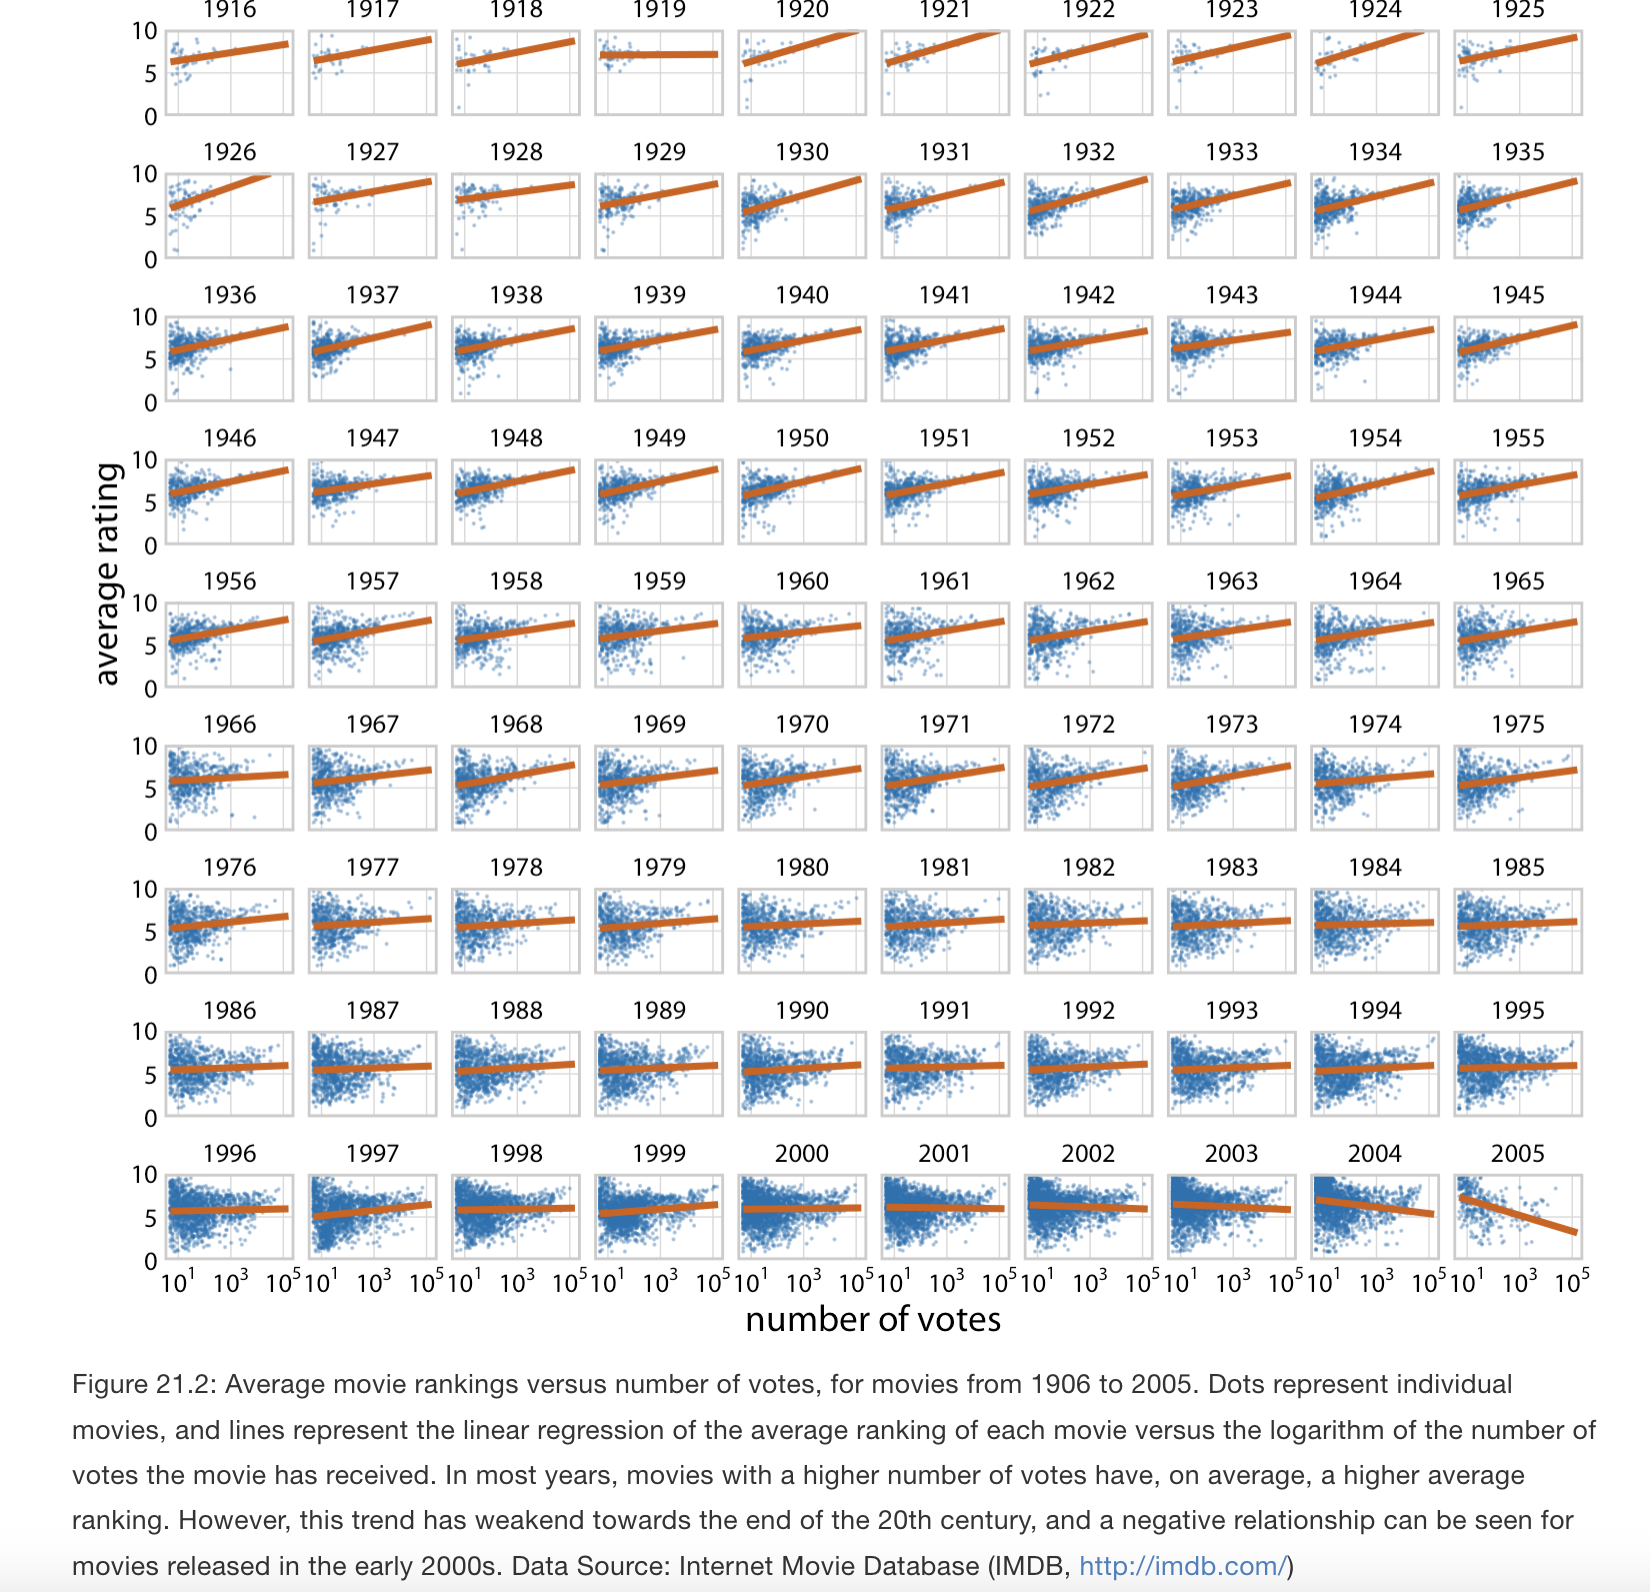
- This idea refers to: slice dataset along one or more dimensions (e.g. by year, by class, by group), plot each slice using the same visualization style, then arrange panels in a grid.
- Also known as faceting (e.g.,
facet_grid in ggplot2)
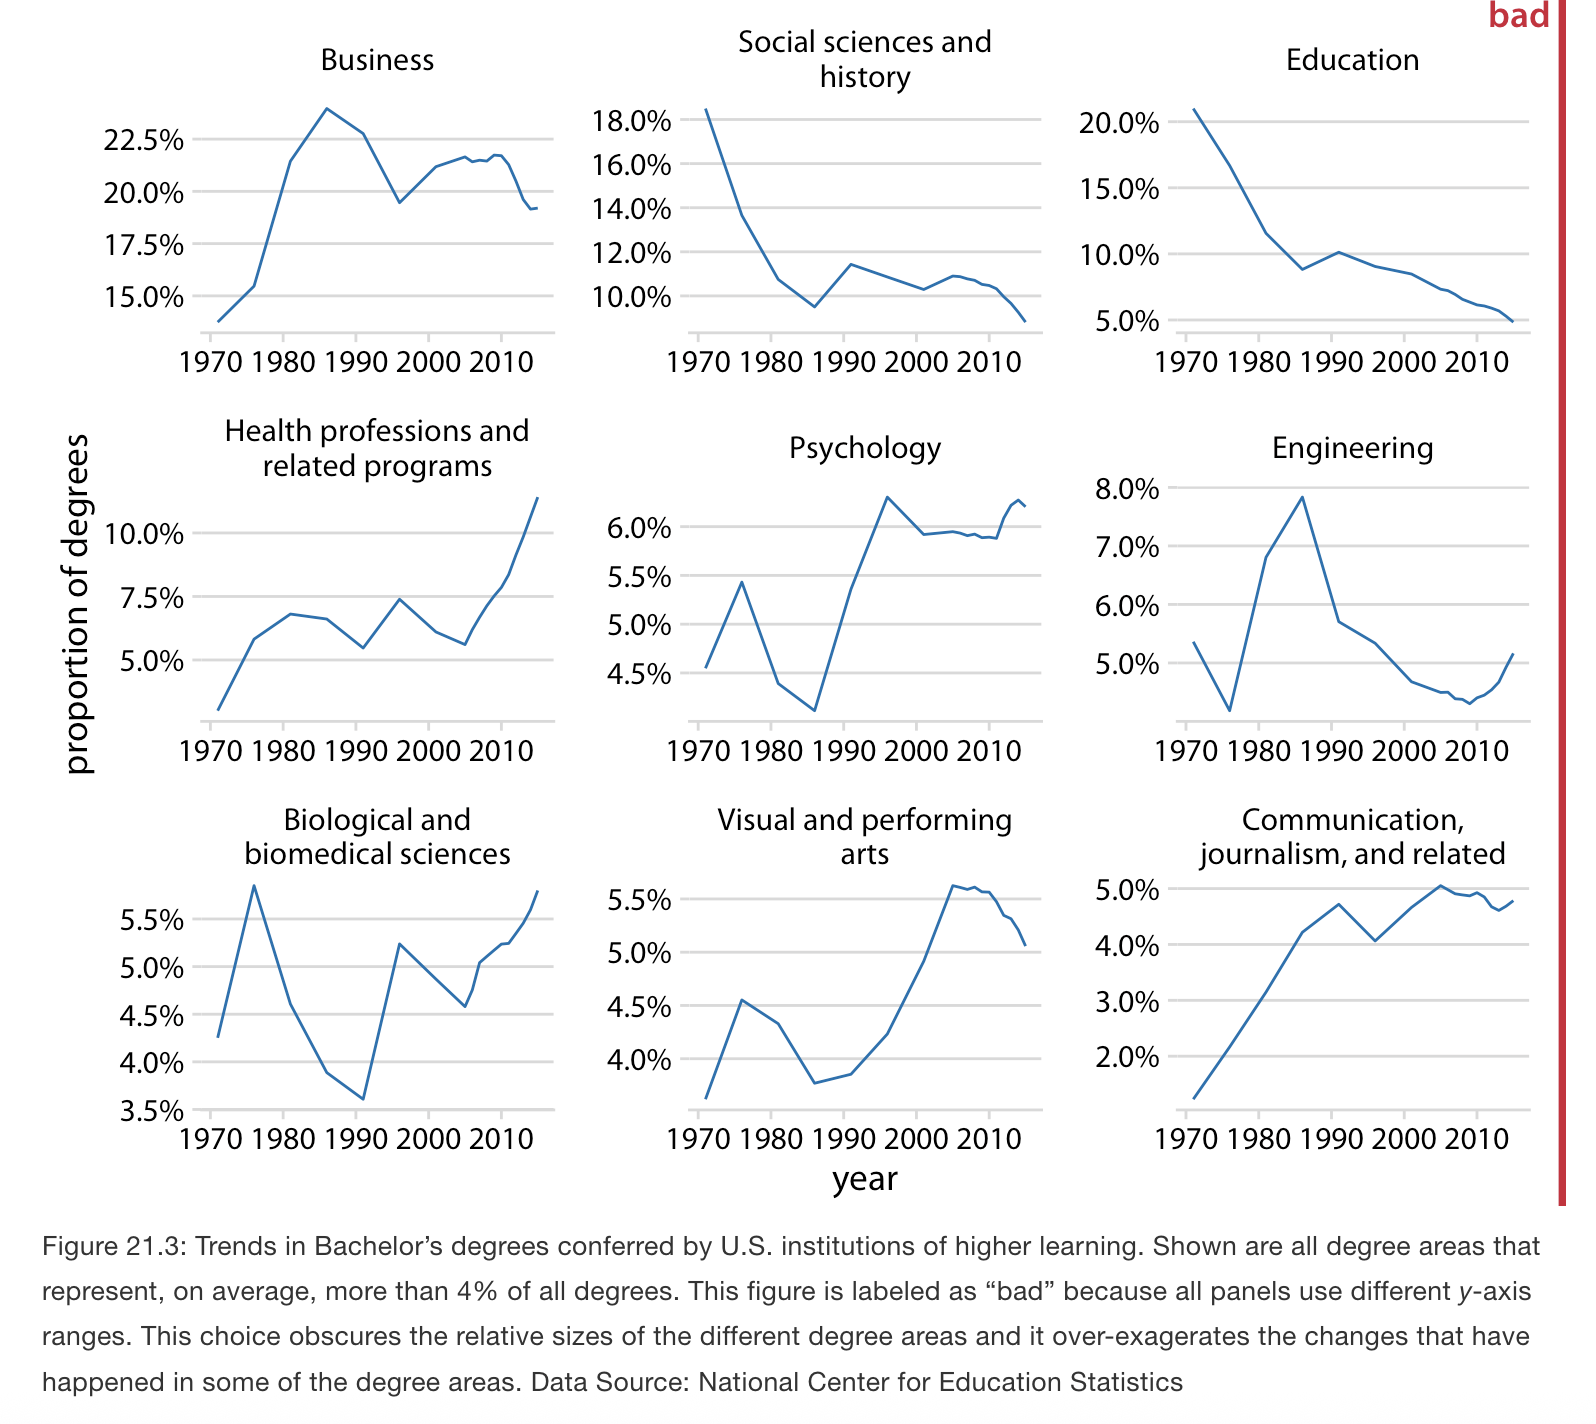
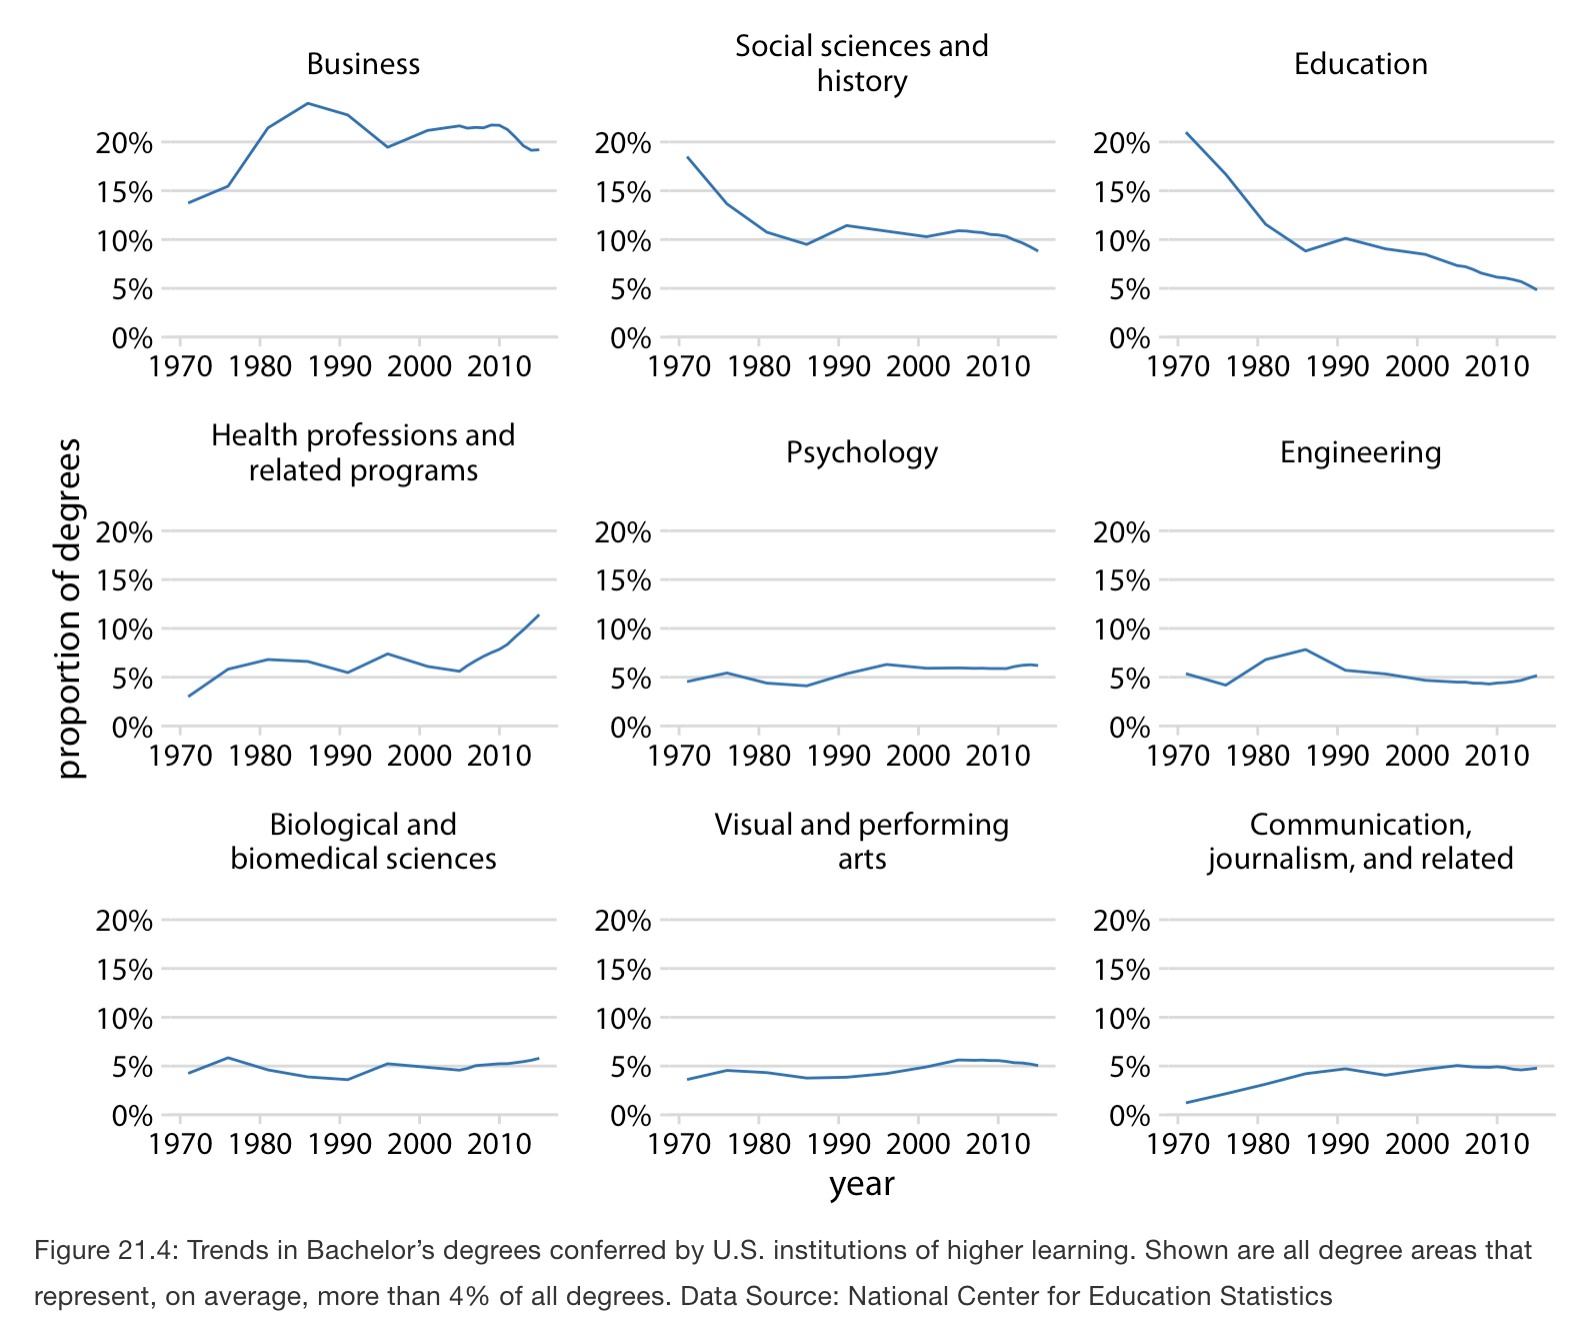
- All panels should ideally use the same axis scales and ranges. If not, the reader may misinterpret differences (or be misled).
- If you must use different scales (rarely advisable), note it explicitly in the caption so the reader isn’t fooled.
- Panel ordering matters: the arrangement of panels should be meaningful or logical (e.g. chronological order, by magnitude, etc.).