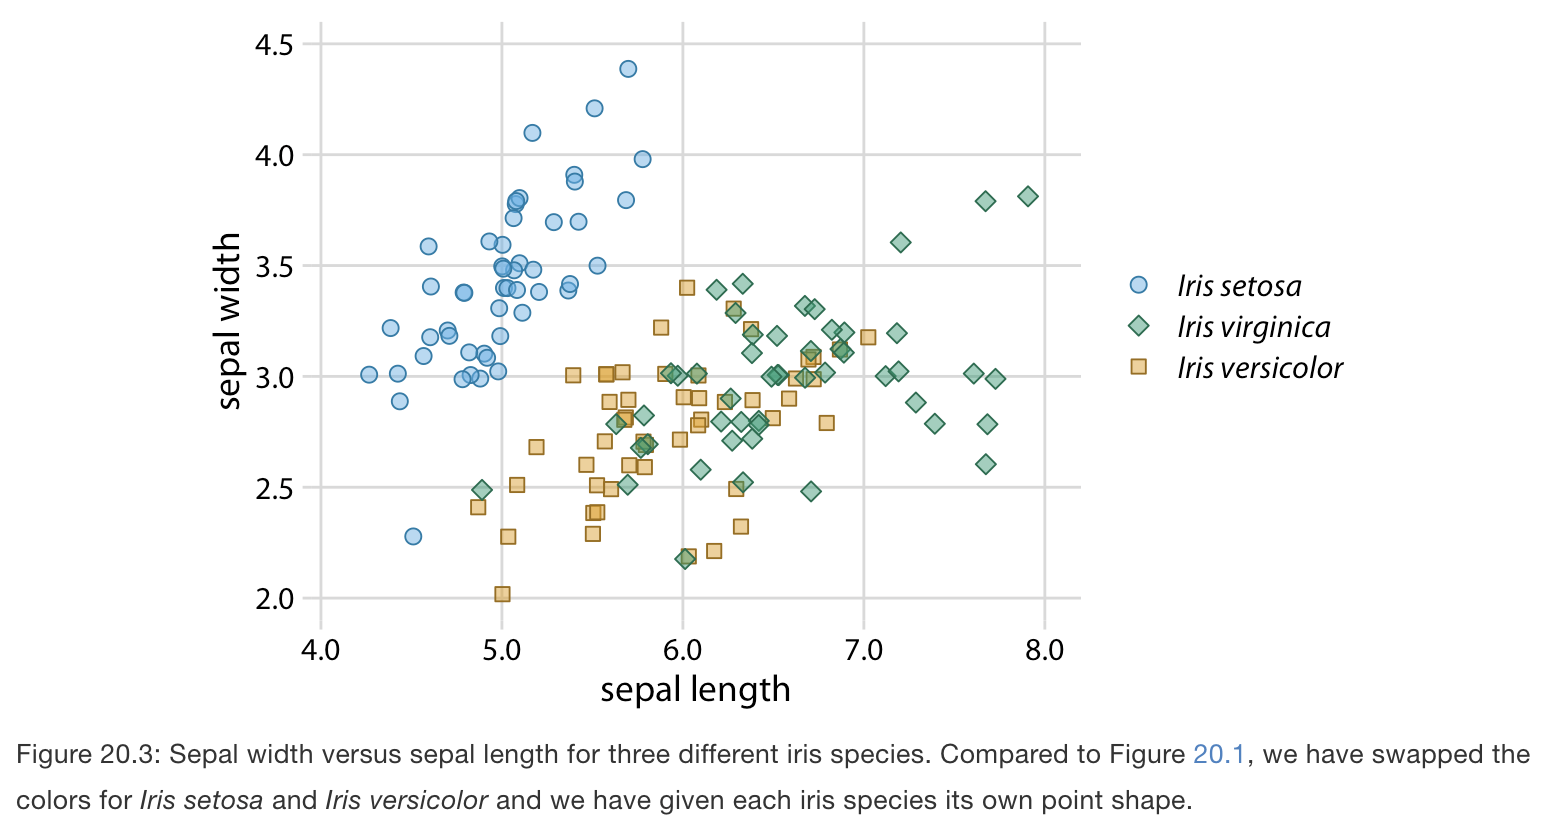
Designing legends with redundant coding for scatter plots
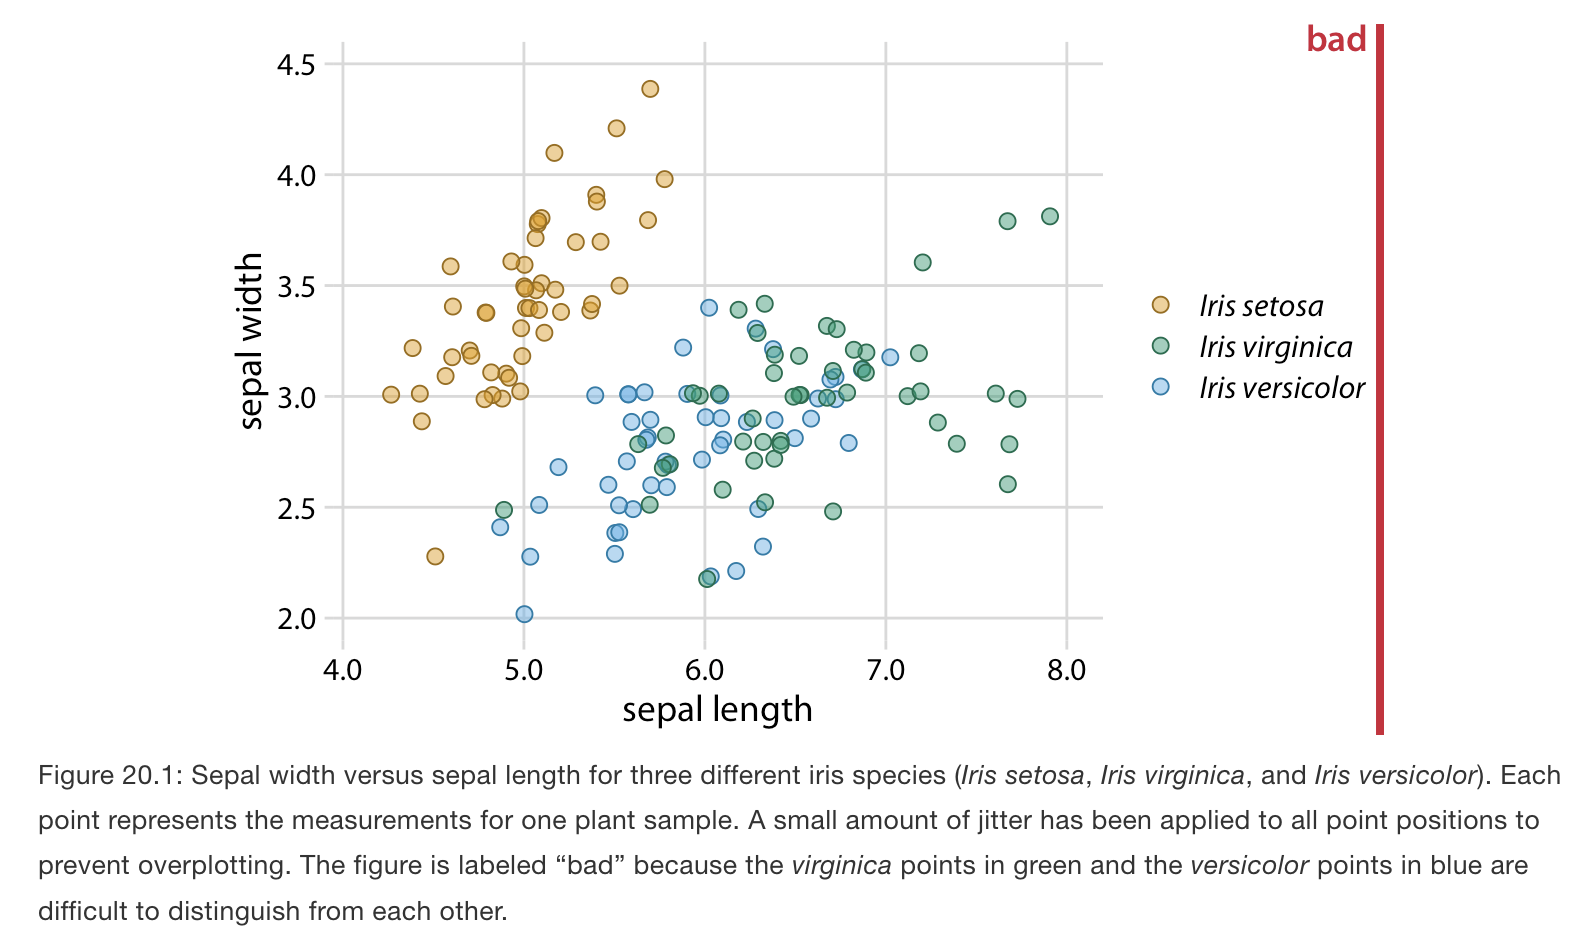
- Scatter plots that represent different groups that differ by color.
- The problem arises because the data points in two separate groups are not particularly distinct from each other.
- Using gray scale does not work because sometimes categories cannot be distinguishable enough.
- To fix this problem: we can use three different symbol shapes, so that the points all look different.