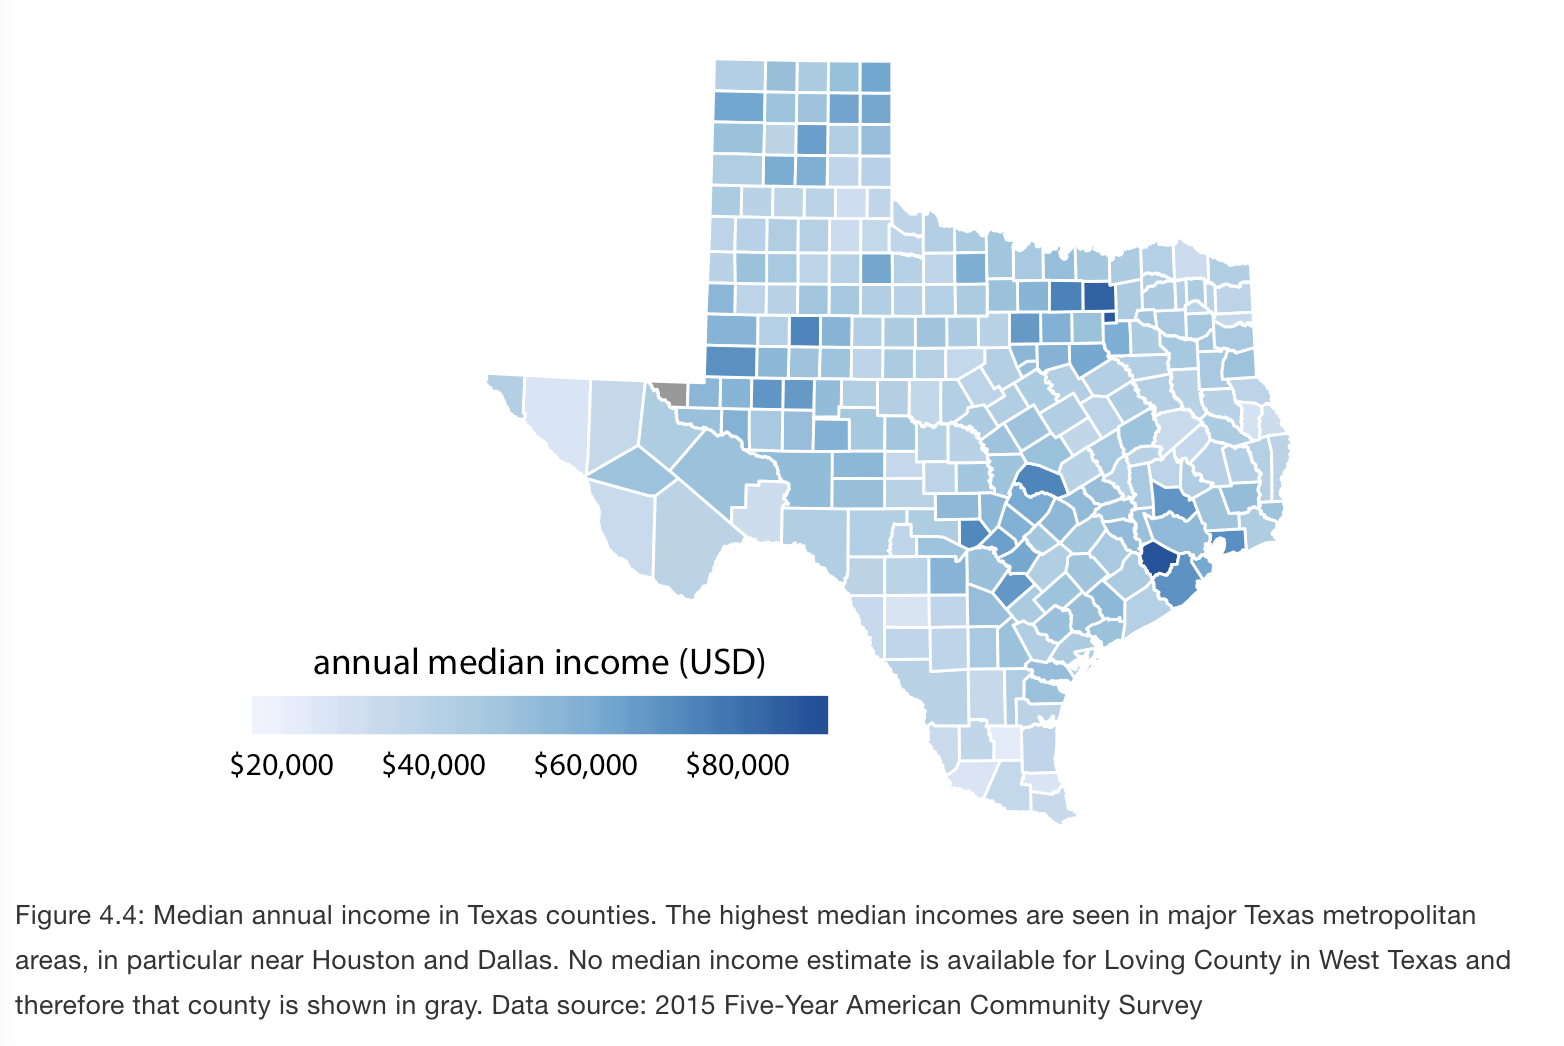
Color to represent data values
- Colors can be used to represent data values: incomes, temperature, speed.
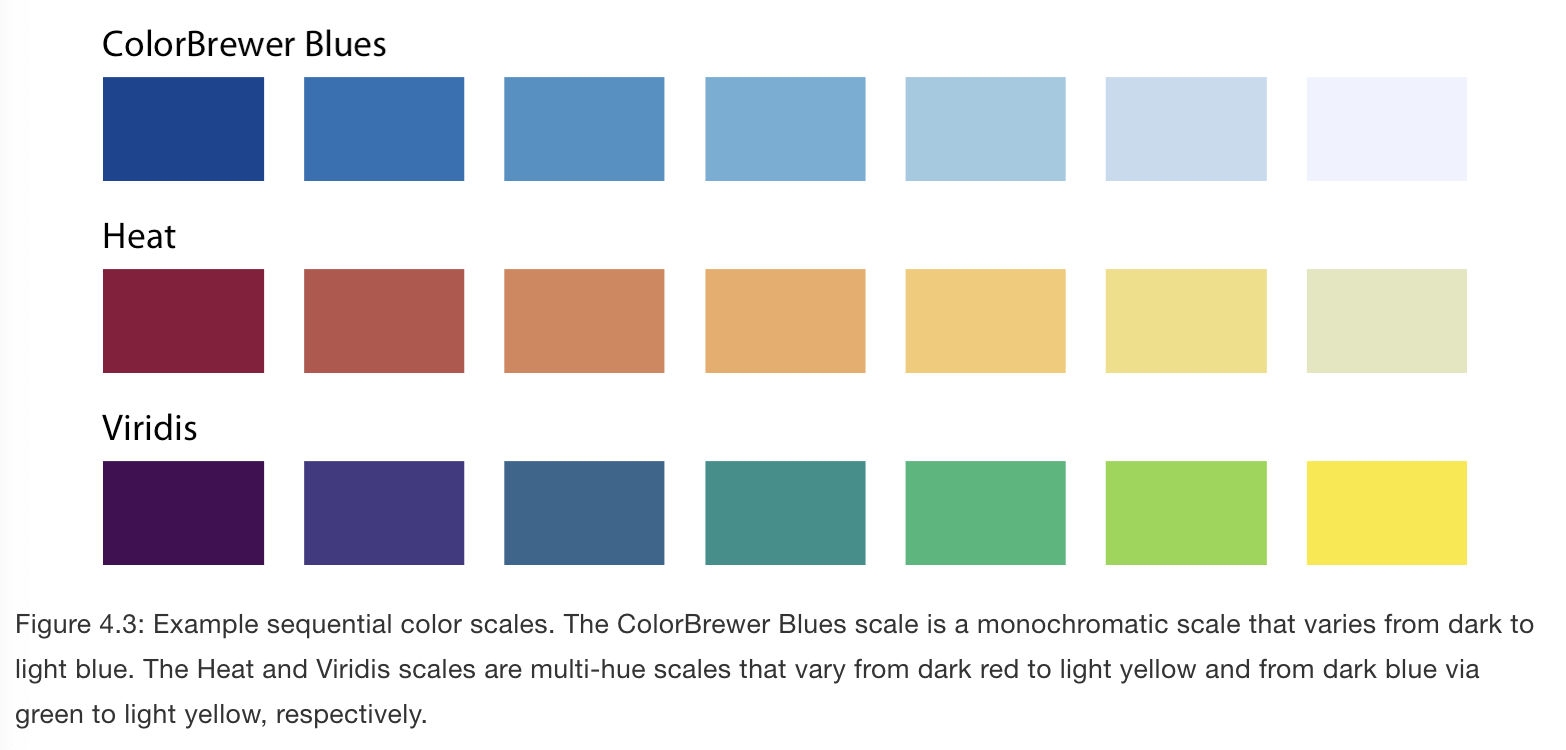
- Sequential color scale
- This sequence will indicate
- which values are larger or smaller
- color scale needs to be perceived to vary uniformly across range
- how distant two specific values are from each other
- may be based on a single hue (light blue to dark blue) or multiple hues (light yellow to dark red)
- multi-hue scales follow a color gradient that is considered “natural”
Example: choropleths. Map of annual median income within each county in Texas.