How to properly work with log scales in bar plots
- A log scale is the natural scale to visualize ratios, because a unit step along a log scale corresponds to multiplication with or division by a constant factor.
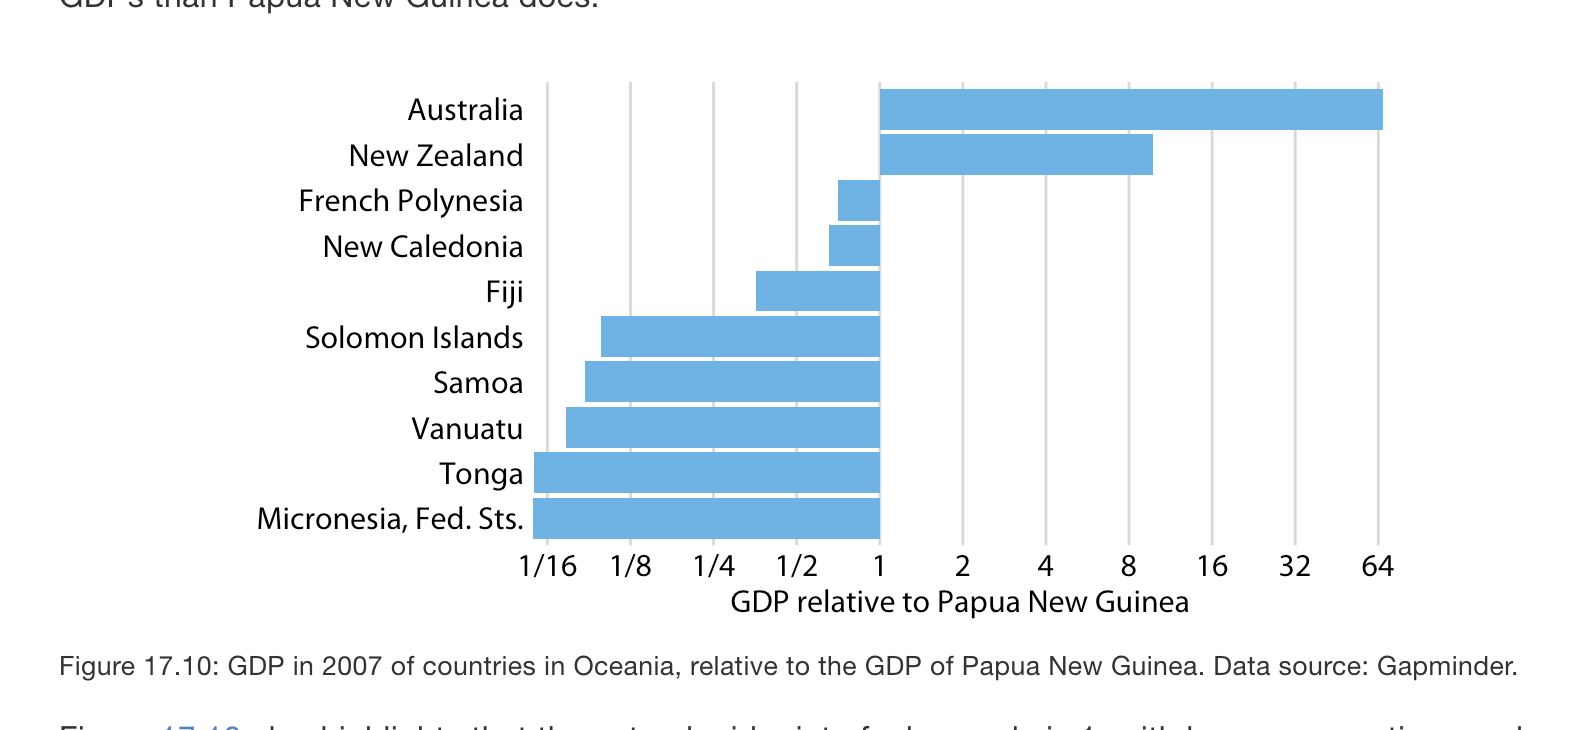
- When bars are drawn on a log scale, they represent ratios and need to be drawn starting from 1, not 0.
- If we want to visualize ratios rather than amounts, however, bars on a log scale are a perfectly good option. In fact, they are preferable over bars on a linear scale in that case.
- As an example, let’s visualize the GDP values of countries in Oceania relative to the GDP of Papua New Guinea.