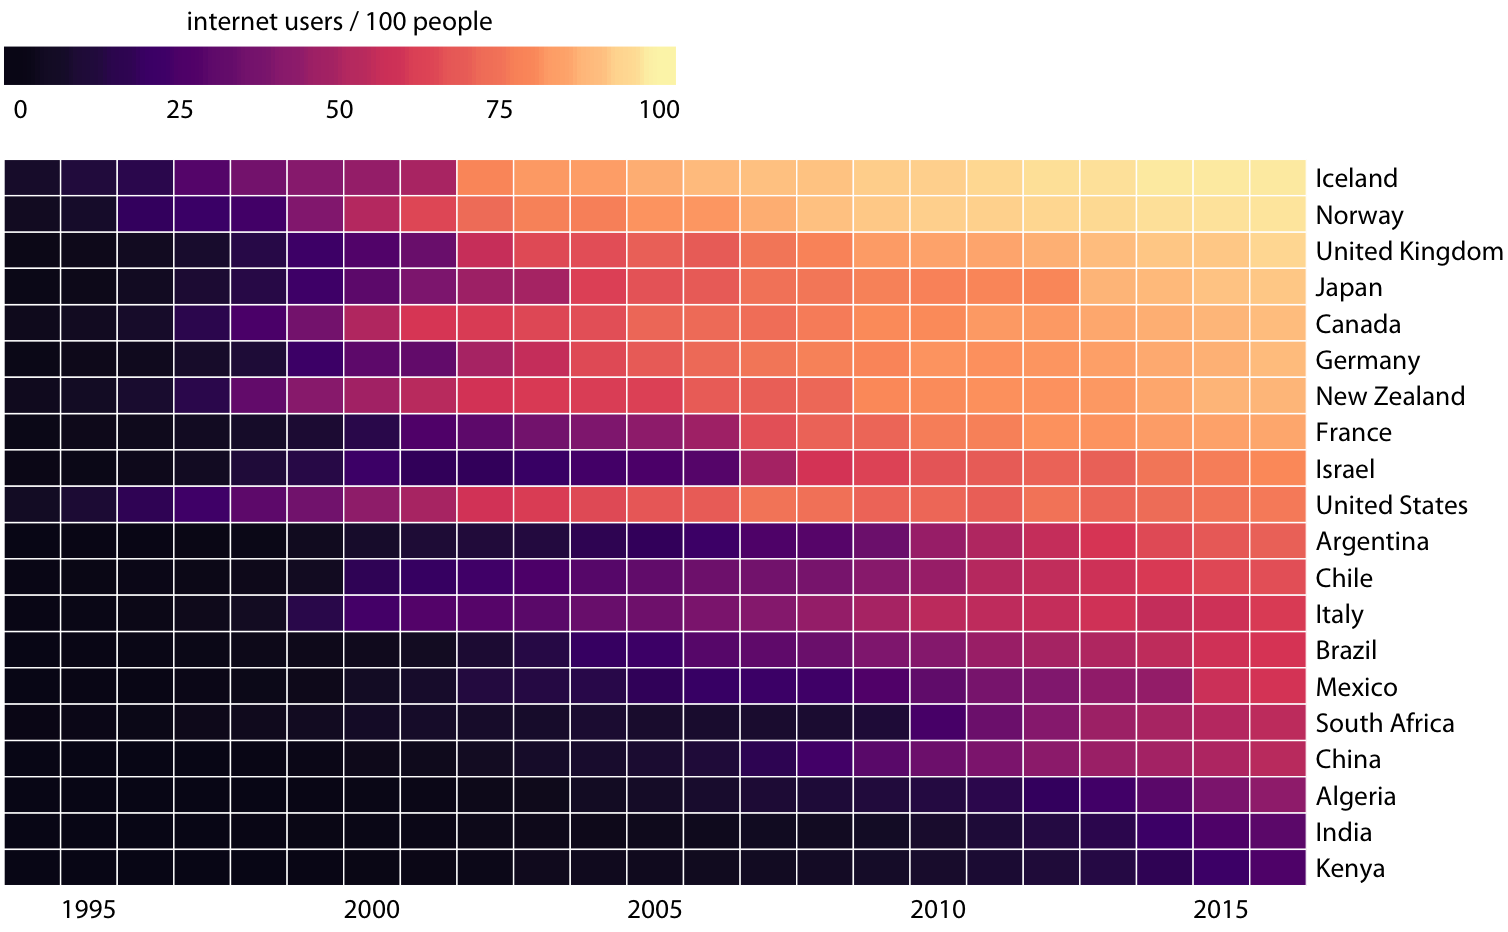
6.2 6.3 Dot plots and heatmaps
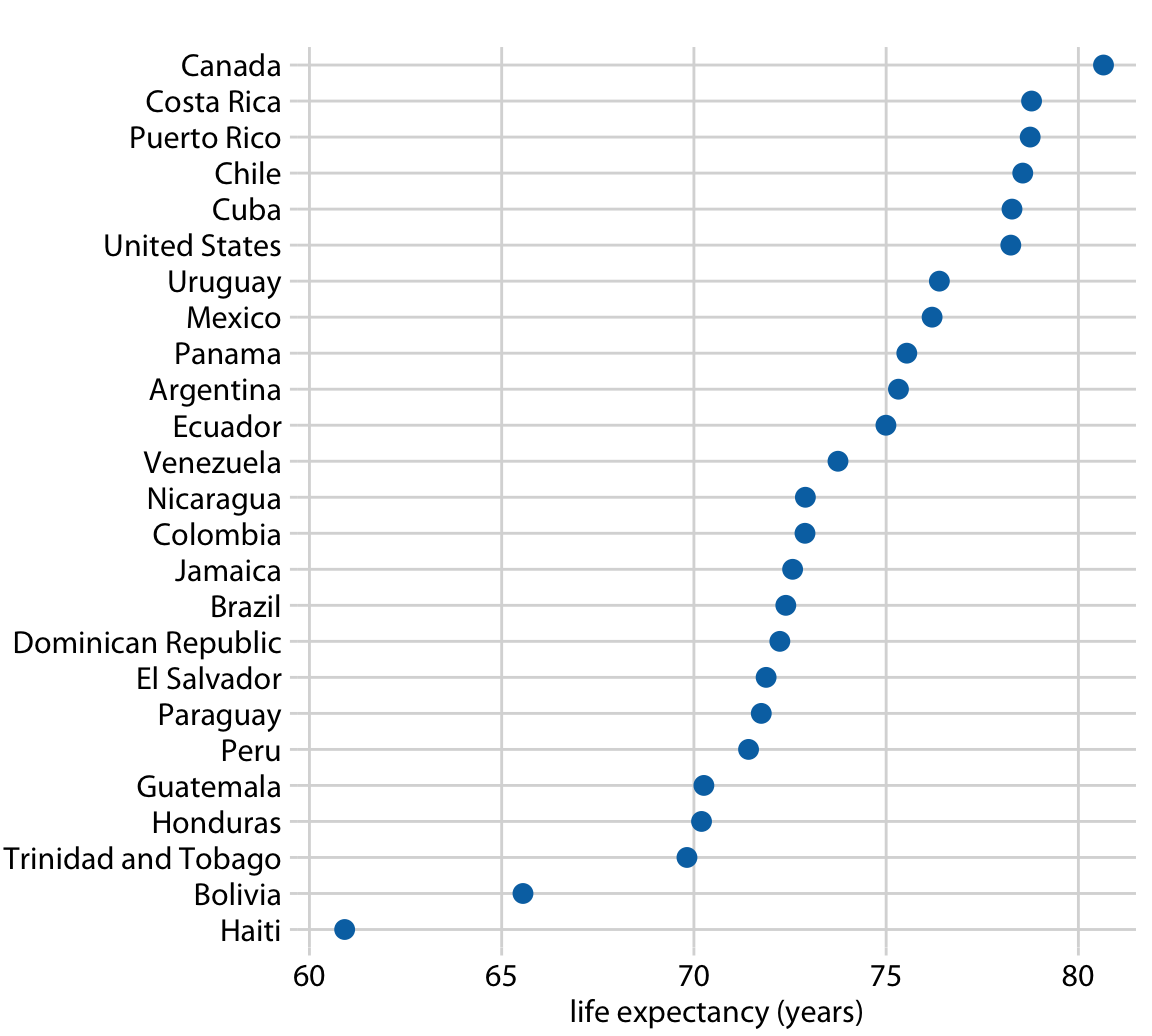
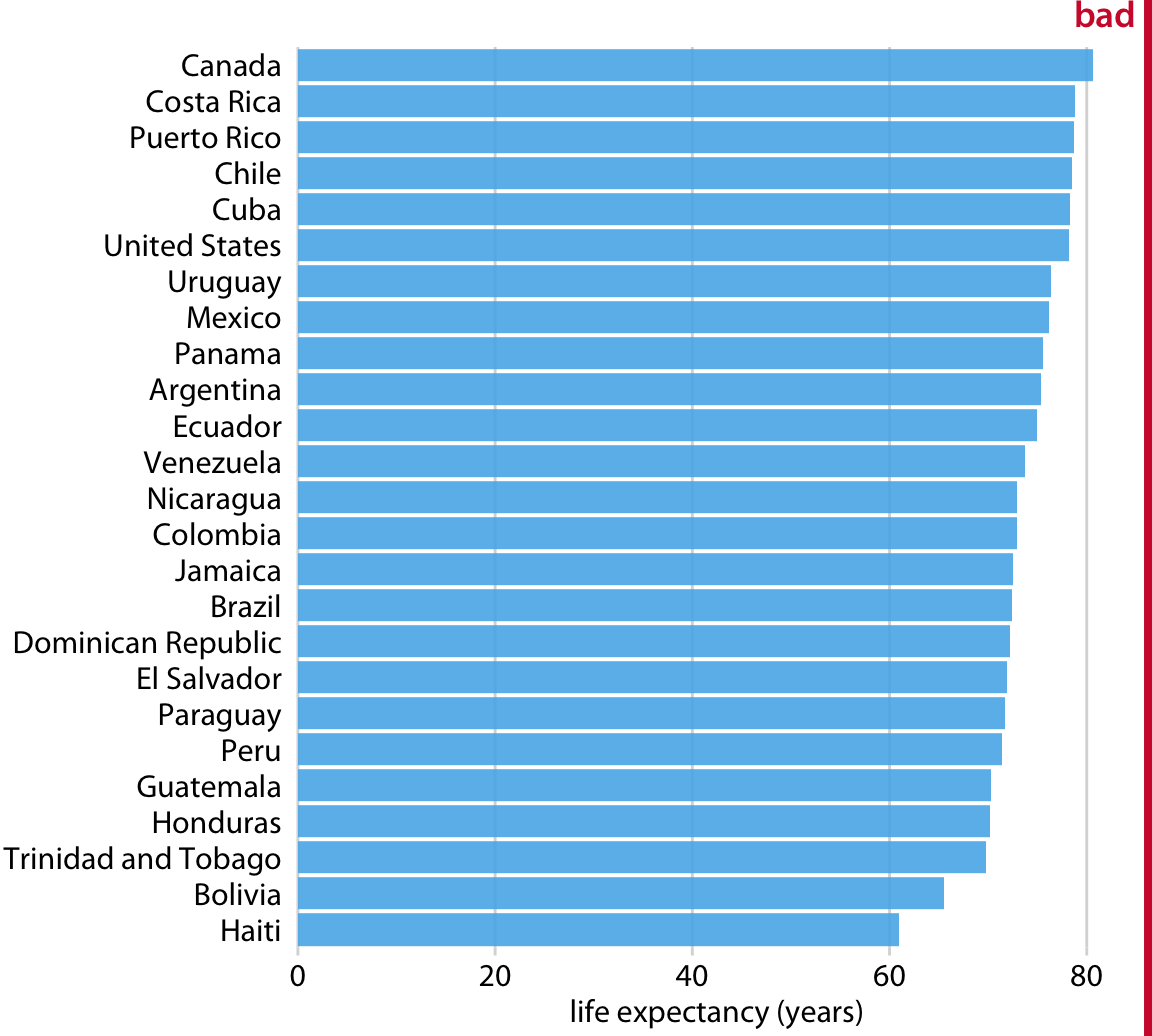
- Axes don’t need to start at zero, therefore useful for visualizing differences among similar amounts
Heatmaps encode the amount as a colour aesthetic and are useful for visualizing two categorical variables with many values
As in bar charts, ordering matters in dot plots and heatmaps to the message