7.1 Visualizing a single distribution
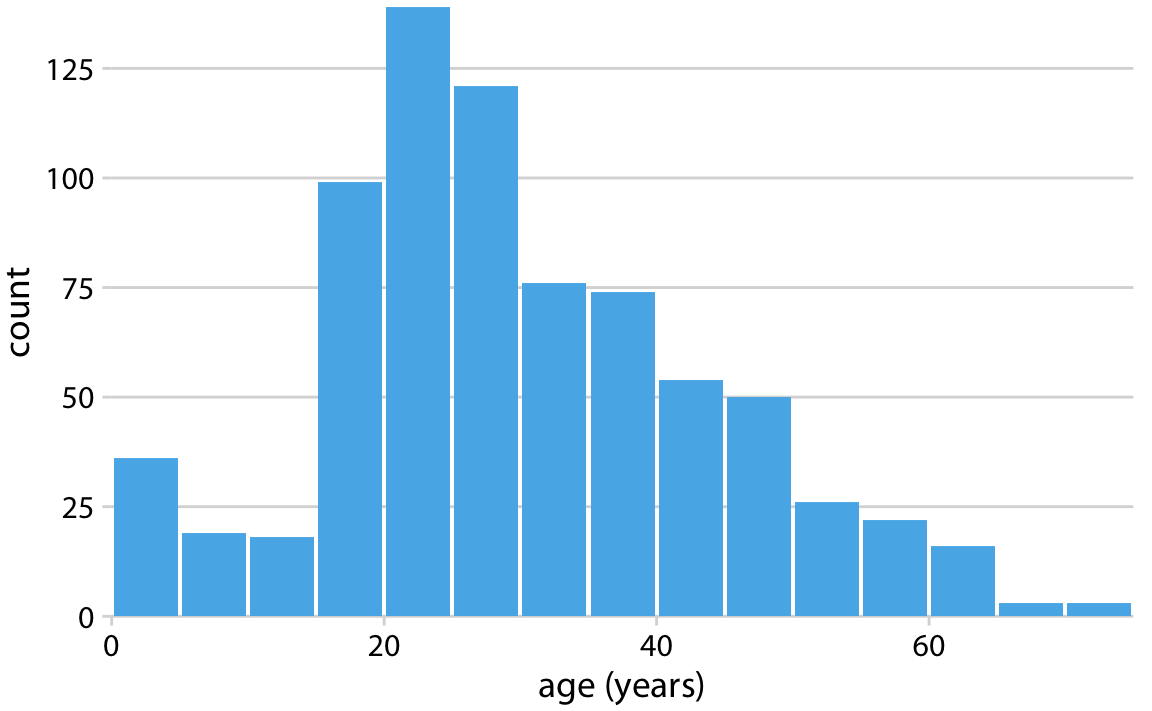
Histograms are useful in visualizing distributions
Basically turning a quantitative variable into a qualitative variable via binning
Choice of how large each bin should be affects interpretation
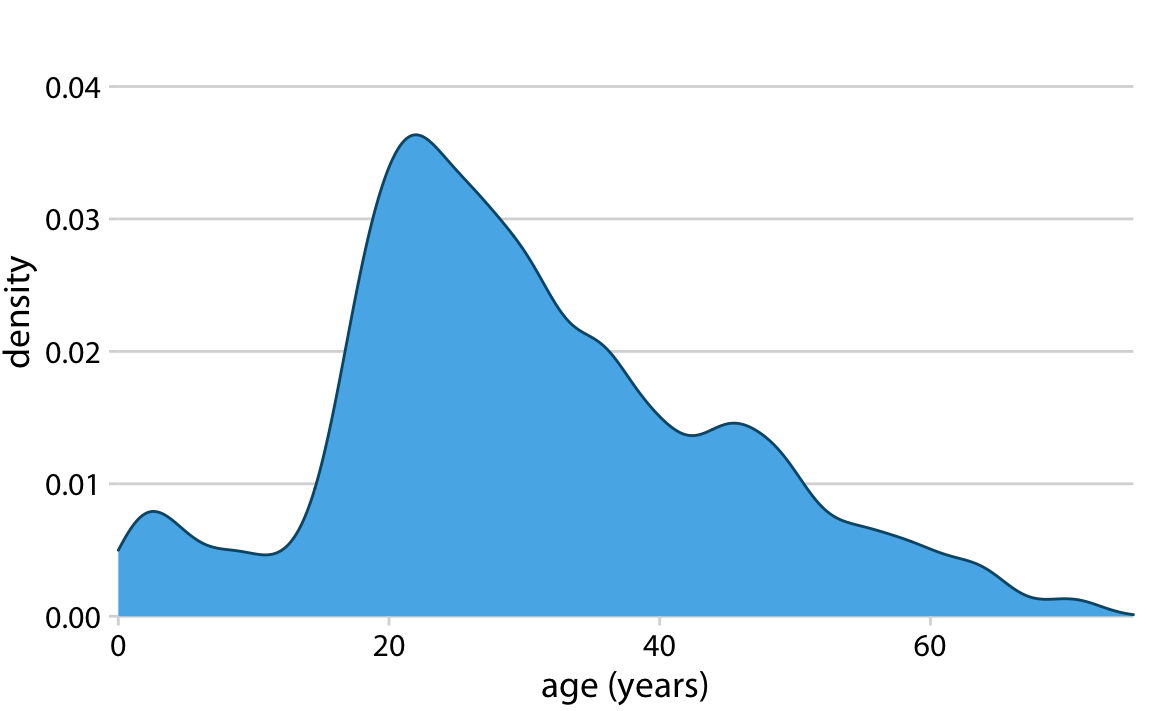
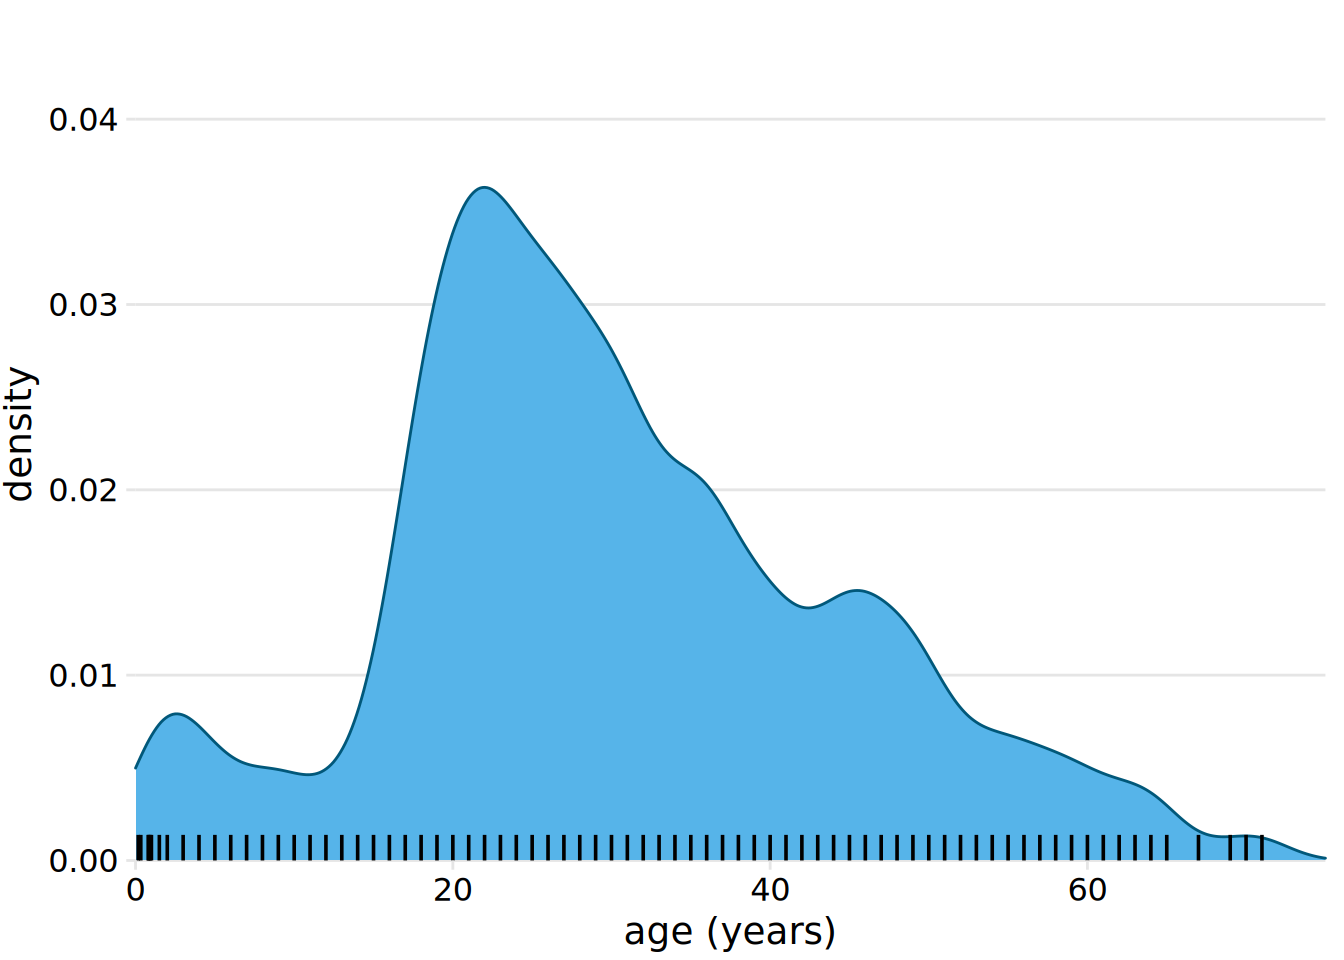
Density plots are similar to histograms but have important caveats:
The kernel choice (e.g. Gaussian, rectangular) should make sense given your knowledge of the distribution
May be misleading for discrete quantitative variables (e.g. counts)
Suggests data exists where none exists