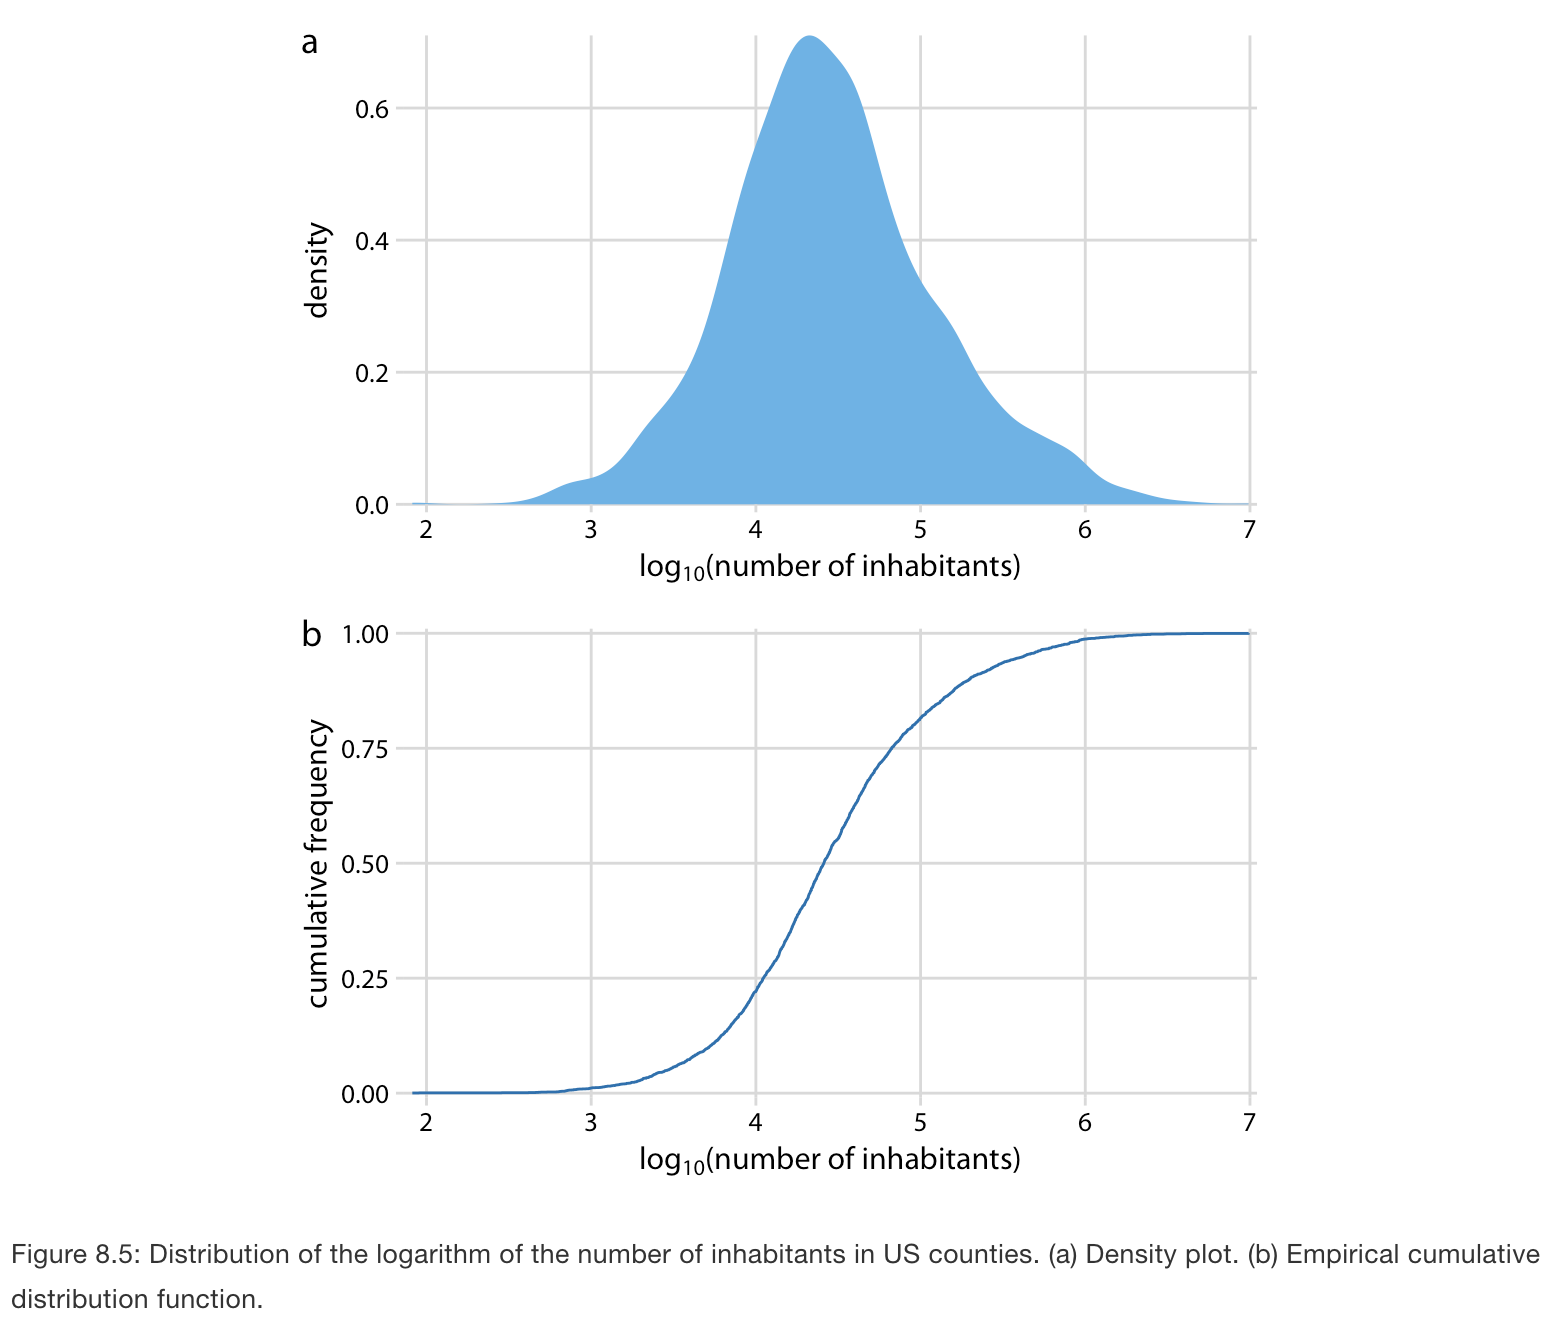
Highly skewed distributions
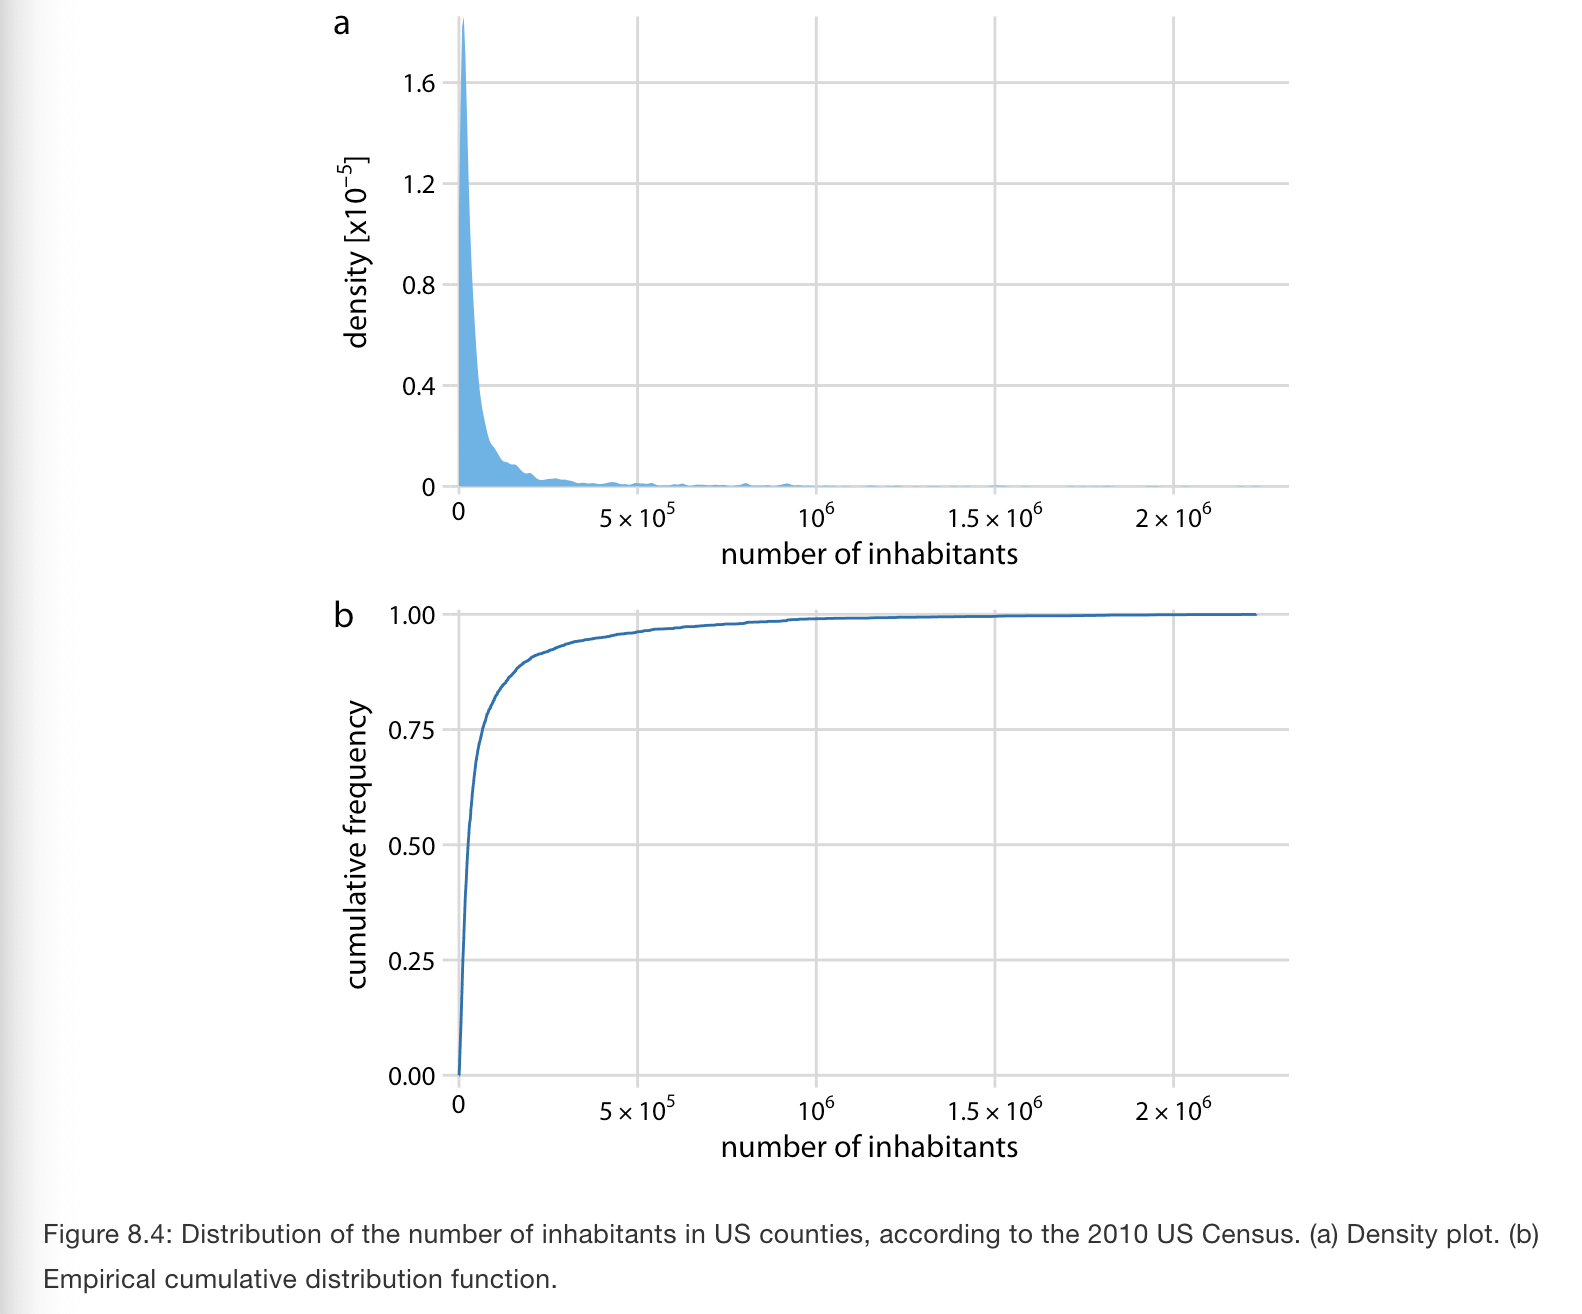
- Heavy tails to either side.
- If we try to visualize these distributions then we end up with graphs that are useless:
- Solution: let’s log-transform the data and visualize the distribution of log-transformed values. This works because the population numbers in counties follows a log-normal distribution.