Visualizations along linear axes
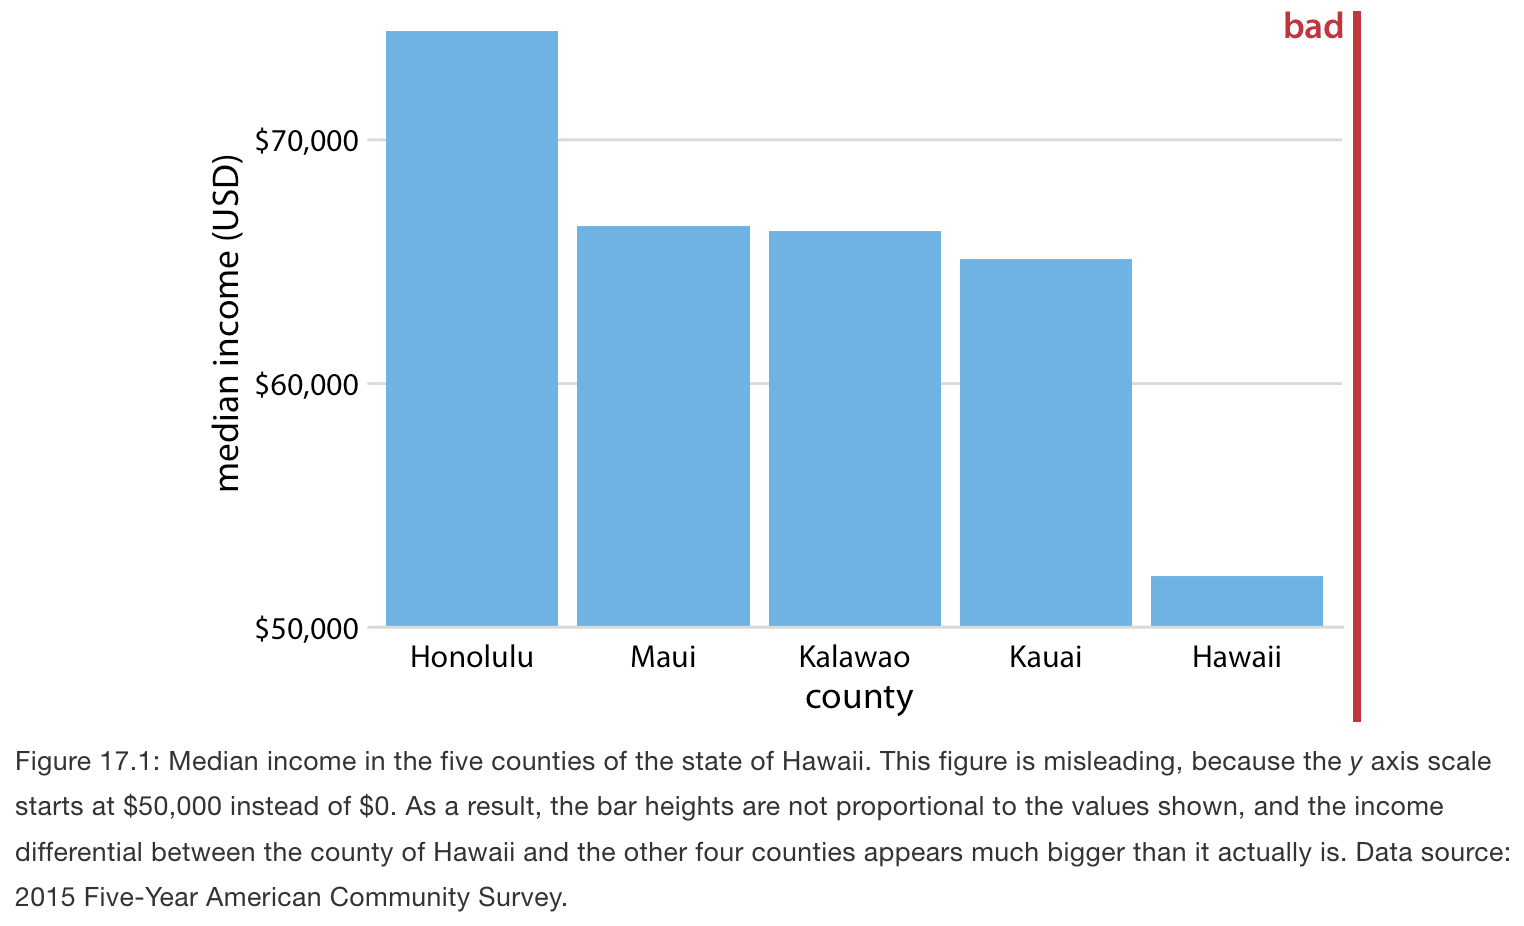
- Consider the following graph that shows the median income in the five counties that make up the state of Hawaii.
- This graph is misleading because while the endpoint of each bar correctly represents the actual median income in each county, the bar height represents the extent to which median incomes exceed $50,000, an arbitrary number.
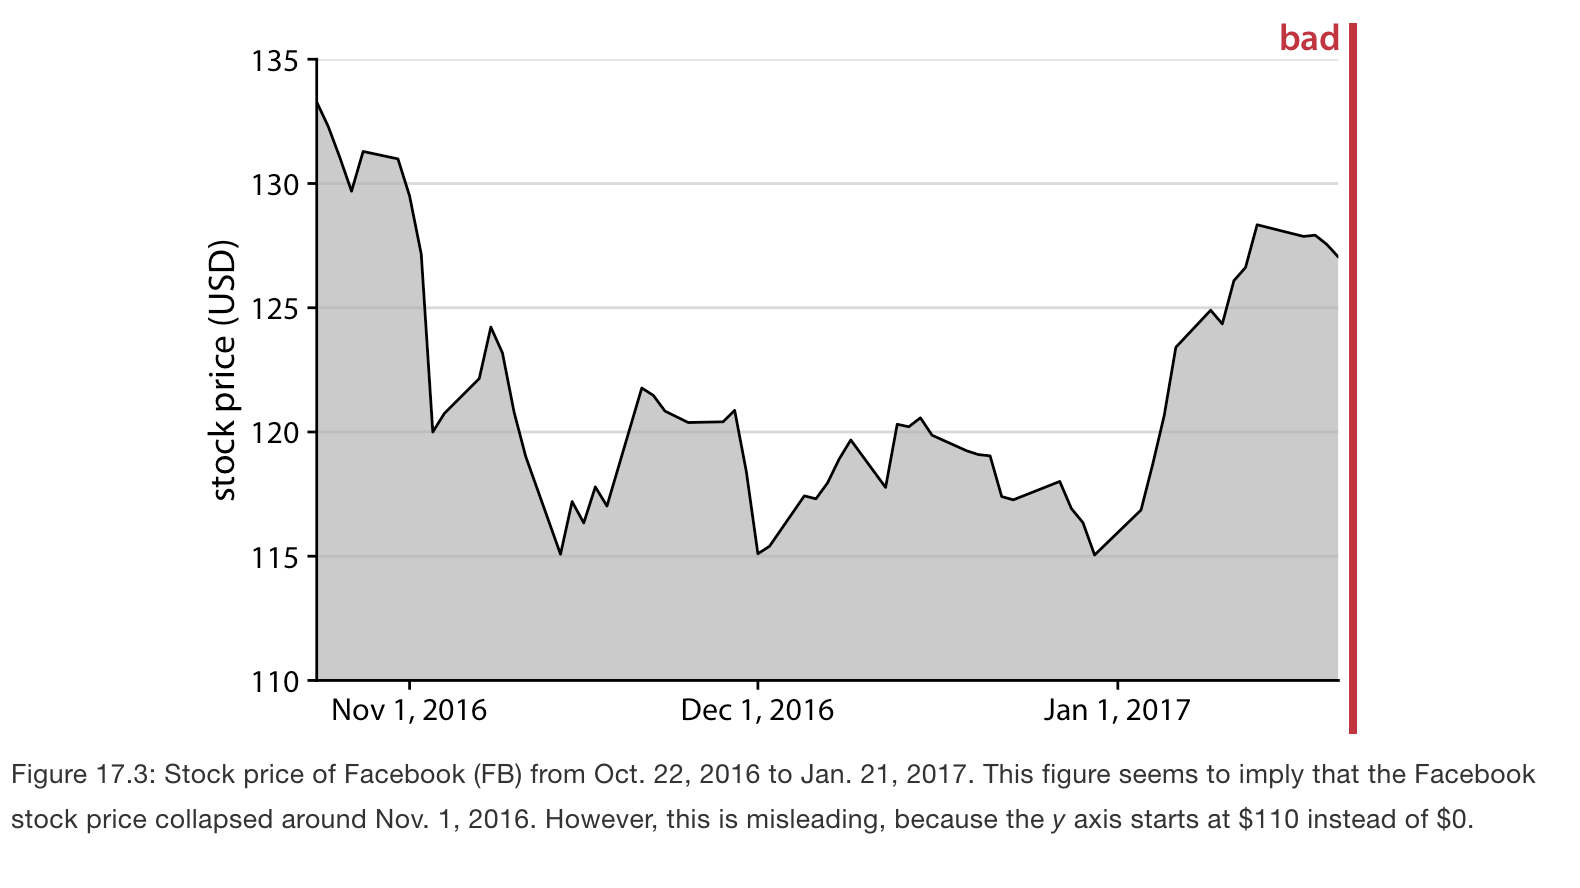
- Similar issues arise with area graphs.