8.8 Missing data patterns for stations originally in the Chicago ridership data
Fig. 8.5
miss_entries <-
     raw_entries %>%
     dplyr::select(-date) %>%
     is.na()
miss_num <- apply(miss_entries, 2, sum)

has_missing <- vapply(raw_entries[, -1], function(x) sum(is.na(x)) > 1, logical(1))
miss_station <- names(has_missing)[has_missing]

# do clustering on just the station data (not time) and get a reordering
# of the stations for plotting
miss_data <-
     raw_entries[, miss_station] %>%
     is.na()

clst <- hclust(dist(t(miss_data)))
clst_stations <-
     tibble(
          station_id = colnames(miss_data),
          order = clst$order
     )

station_names <-
     stations %>%
     dplyr::select(name, station_id) %>%
     right_join(clst_stations, by = "station_id")

station_lvl <- station_names[["name"]][station_names$order]

miss_vert <-
     raw_entries %>%
     gather(station_id, raw_entries, -date) %>%
     filter(station_id %in% miss_station) %>%
     mutate(status = ifelse(is.na(raw_entries), "missing", "complete")) %>%
     full_join(station_names, by = "station_id") %>%
     mutate(
          name = factor(name, levels = station_lvl),
          status = factor(status, levels = c("missing", "complete"))
     )

miss_vert %>%
     ggplot(aes(x = date, y = name, fill = status)) +
     geom_tile() +
     ylab("") + xlab("") +
     scale_fill_grey() +
     theme(legend.position = 'top')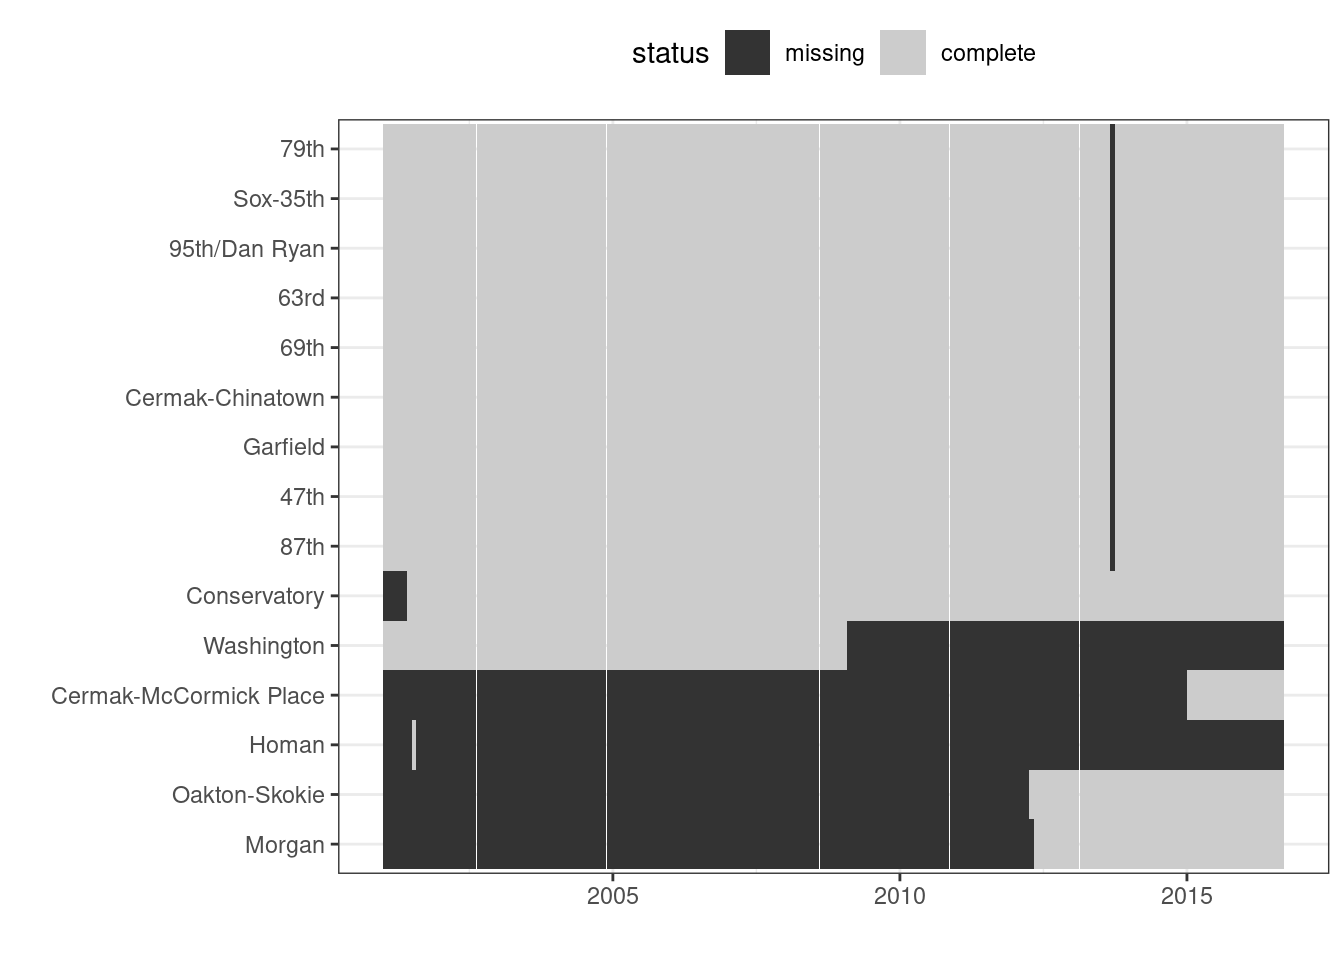
There are nine stations whose data are almost complete except for a single month gap. These stations are all on the Red Line and occur during the time of the Red Line Reconstruction Project that affected stations north of Cermak-Chinatown to the 95th Street station.