9.1 Illustrative Data: Pharmaceutical Manufacturing Monitoring
9.1.1 Introduction
Pharmaceutical companies use spectroscopy measurements to assess critical process parameters during the manufacturing of a biological drug (Berry et al. 2015). Models built on this process can be used with real-time data to recommend changes that can increase product yield. In the example that follows, Raman spectroscopy was used to generate the data77 (Hammes 2005). To manufacture the drug being used for this example, a specific type of protein is required and that protein can be created by a particular type of cell. A batch of cells are seeded into a bioreactor which is a device that is designed to help grow and maintain the cells. In production, a large bioreactor would be about 2000 liters and is used to make large quantities of proteins in about two weeks.
Company is trying to produce a biological drug that produces special proteins.
Cell are placed in a bioreactor where they produce the proteins (the yield)
Factors like food and temperature can be recorded, as well as cell specific cellular data like glucose production and ammonia (which can negatively impact the yield)
Measuring glucose and ammonia is time consuming, so spectroscopy measurements are taken from 15 small reactors and 3 large reactors.
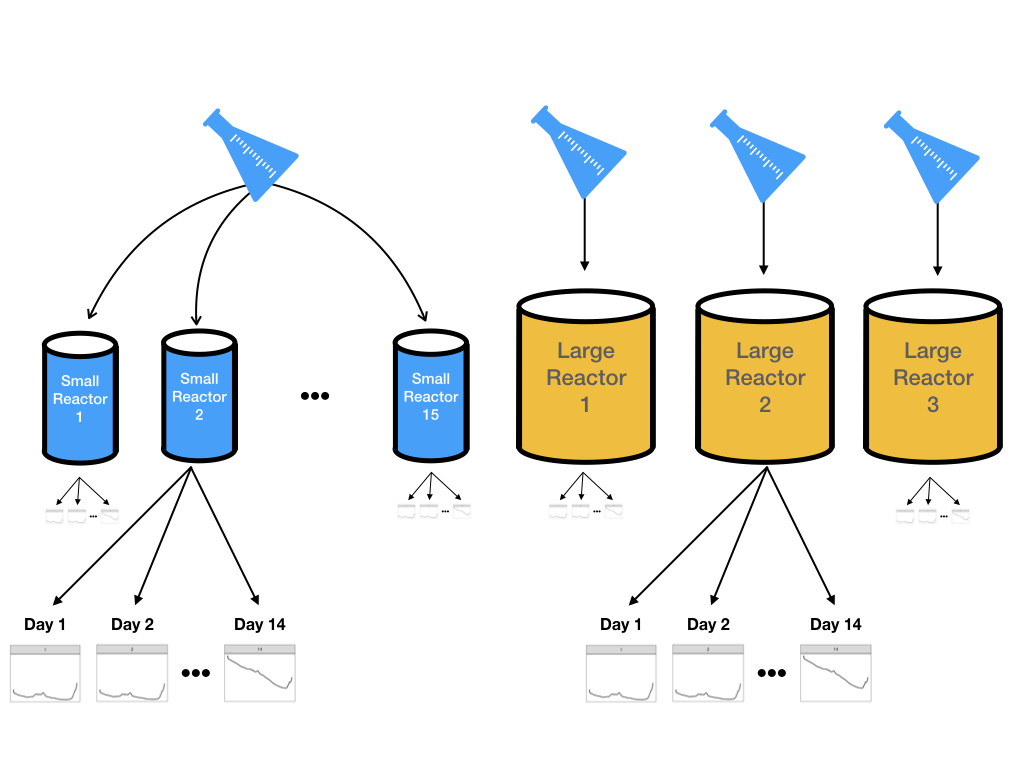
A schematic for the experimental design for pharmaceutical manufacturing.
The goal here is to see if we can take the results from the small reactors to predict the results of the big reactors.
9.1.2 IMPORTANT DEFINITIONS !
Spectroscopy is the general field of study that measures and interprets the electromagnetic spectra that result from the interaction between electromagnetic radiation and matter as a function of the wavelength or frequency of the radiation.
Spectra/Spectrum, a band of colors, as seen in a rainbow, produced by separation of the components of light by their different degrees of refraction according to wavelength.
Radiant Intensity: In radiometry, radiant intensity is the radiant flux emitted, reflected, transmitted or received, per unit solid angle, and spectral intensity is the radiant intensity per unit frequency or wavelength
9.1.3 Preliminary Results
Looking at the spectra over multiple days we see that the intensity exhibits similar patterns in the small and large reactors. The difference being the big reactors lead to slightly higher intensities


(a) Spectra for a small- and large-scale reactor on days 1, 7, and 14. (b) The spectra for a single reactor over 14 days.