3.2 How to summarize collection of data points: The idea behind statistical distributions
3.2.2 Measurements of variation
- range
- standard deviation
- variance: affected by outliers
- adj variance
- percentiles: difference between 75th percentile and 25th percentile removes potential outliers
3.2.3 Statistical distributions
probability of occurrence
- normal distribution or Gaussian distribution: typical “bell-curve”
3.2.4 Confidence intervals
- bootstrap resampling or bootstrapping: estimate intervals is to repeatedly take samples from the original sample with replacement.
library(mosaic)
set.seed(21)
sample1= rnorm(50,20,5) # simulate a sample

# do bootstrap resampling, sampling with replacement
boot.means=do(1000) * mean(resample(sample1))

# get percentiles from the bootstrap means
q=quantile(boot.means[,1],p=c(0.025,0.975))

# plot the histogram
hist(boot.means[,1],col="cornflowerblue",border="white",
                    xlab="sample means")
abline(v=c(q[1], q[2] ),col="red")
text(x=q[1],y=200,round(q[1],3),adj=c(1,0))
text(x=q[2],y=200,round(q[2],3),adj=c(0,0))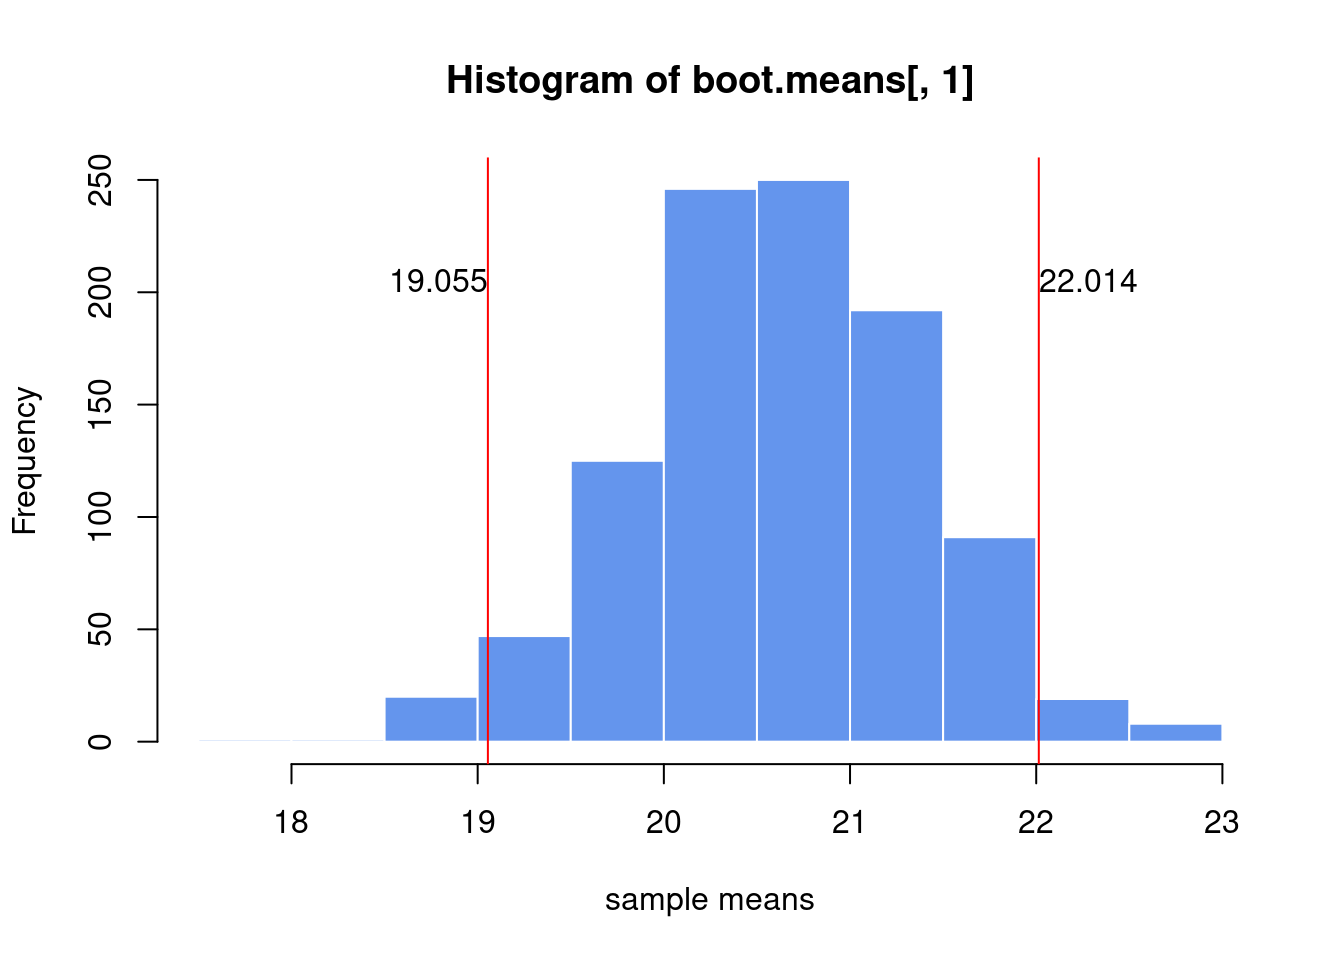
- Central Limit Theorem(CLT): construct the confidence interval using standard normal distribution, take repeated samples from a population with sample size, the distribution of means of those samples will be approximately normal with mean and standard deviation.