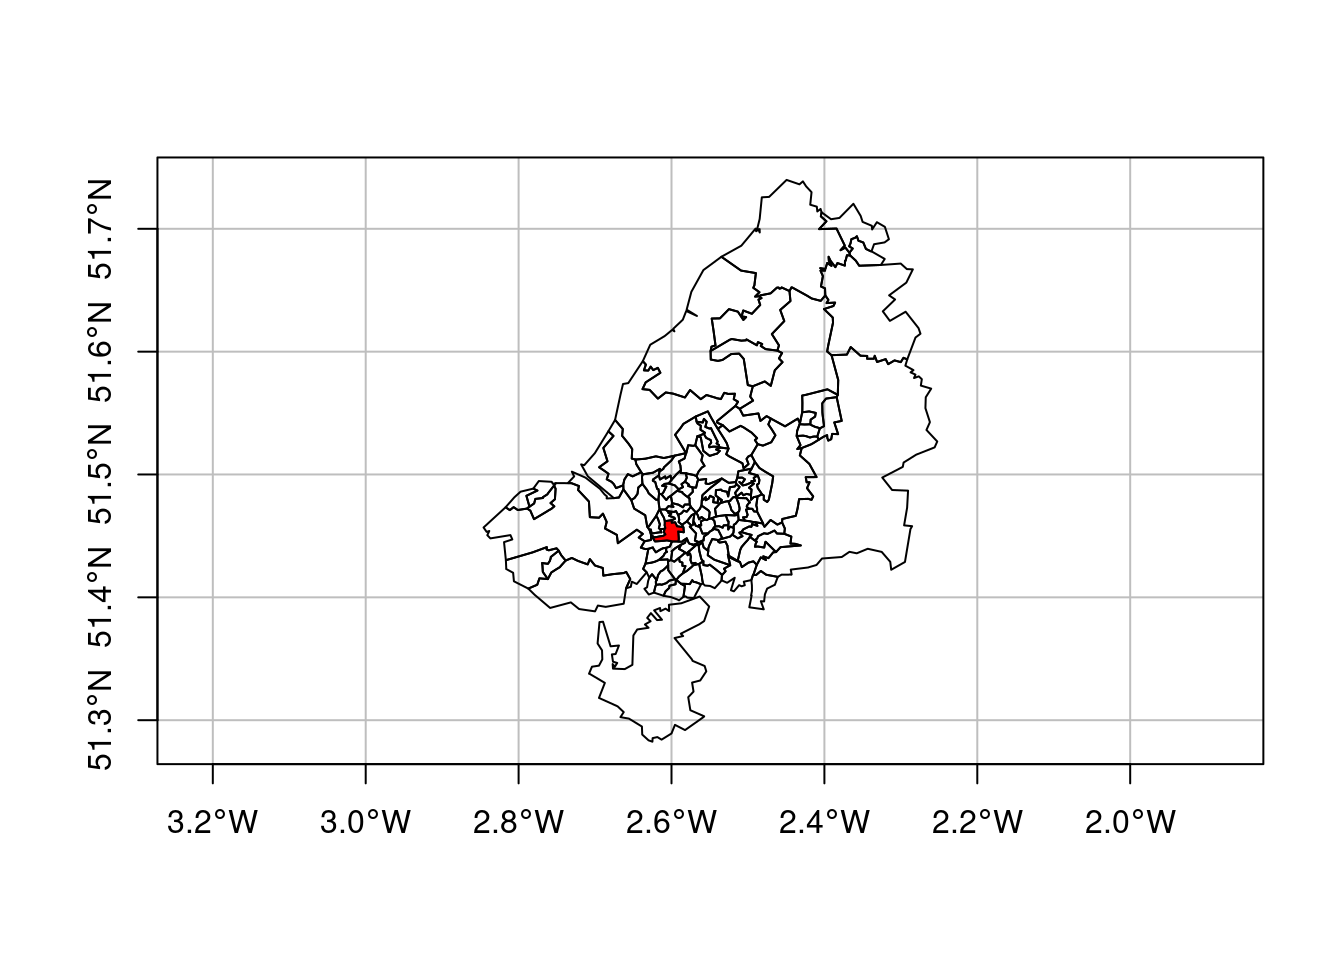
7.15 Example: Transportation

Origin destination data zones for Bristol, UK, with zone 33 (E02003043) coloured red
image code
## # A tibble: 6 × 7
##   o         d           all bicycle  foot car_driver train
##   <chr>     <chr>     <dbl>   <dbl> <dbl>      <dbl> <dbl>
## 1 E02002985 E02002985   209       5   127         59     0
## 2 E02002985 E02002987   121       7    35         62     0
## 3 E02002985 E02003036    32       2     1         10     1
## 4 E02002985 E02003043   141       1     2         56    17
## 5 E02002985 E02003049    56       2     4         36     0
## 6 E02002985 E02003054    42       4     0         21     0
7.15.1 Preprocessing
# create O-D-mode array:
bristol_tidy <- bristol_od |>
    dplyr::select(-all) |> #caution: MASS also has select()
    pivot_longer(3:6, names_to = "mode", values_to = "n")
head(bristol_tidy)
## # A tibble: 6 × 4
## o d mode n
## <chr> <chr> <chr> <dbl>
## 1 E02002985 E02002985 bicycle 5
## 2 E02002985 E02002985 foot 127
## 3 E02002985 E02002985 car_driver 59
## 4 E02002985 E02002985 train 0
## 5 E02002985 E02002987 bicycle 7
## 6 E02002985 E02002987 foot 35Next, we form the three-dimensional array
- filled with zeroes (at first)
- dimensions are named with the zone names (o, d) and the transportation mode name (mode)
- ensure order of observations in
bristol_zonesandbristol_tidy
od <- bristol_tidy |> pull("o") |> unique()
nod <- length(od)
mode <- bristol_tidy |> pull("mode") |> unique()
nmode = length(mode)
a = array(0L,  c(nod, nod, nmode),
    dimnames = list(o = od, d = od, mode = mode))

a[as.matrix(bristol_tidy[c("o", "d", "mode")])] <-  bristol_tidy$n

order <- match(od, bristol_zones$geo_code)
zones <- st_geometry(bristol_zones)[order]
7.15.2 stars object
d <- st_dimensions(o = zones, d = zones, mode = mode)
odm <- st_as_stars(list(N = a), dimensions = d)
Example: largest number of travellers as its destination
## [1] 33Example: Total transportation by OD
## stars object with 2 dimensions and 1 attribute
## attribute(s):
##      Min. 1st Qu. Median     Mean 3rd Qu. Max.
## sum     0       0      0 19.20636      19 1434
## dimension(s):
##   from  to refsys point
## o    1 102 WGS 84 FALSE
## d    1 102 WGS 84 FALSE
##                                                          values
## o MULTIPOLYGON (((-2.510462...,...,MULTIPOLYGON (((-2.55007 ...
## d MULTIPOLYGON (((-2.510462...,...,MULTIPOLYGON (((-2.55007 ...
Example: Origin totals, by mode
## stars object with 2 dimensions and 1 attribute
## attribute(s):
##      Min. 1st Qu. Median     Mean 3rd Qu. Max.
## sum     1    57.5  214.5 489.7623     771 2903
## dimension(s):
##      from  to refsys point
## o       1 102 WGS 84 FALSE
## mode    1   4     NA FALSE
##                                                             values
## o    MULTIPOLYGON (((-2.510462...,...,MULTIPOLYGON (((-2.55007 ...
## mode                                             bicycle,...,train
Example: Destination totals, by mode
## stars object with 2 dimensions and 1 attribute
## attribute(s):
##      Min. 1st Qu. Median     Mean 3rd Qu.  Max.
## sum     0      13  103.5 489.7623  408.25 12948
## dimension(s):
##      from  to refsys point
## d       1 102 WGS 84 FALSE
## mode    1   4     NA FALSE
##                                                             values
## d    MULTIPOLYGON (((-2.510462...,...,MULTIPOLYGON (((-2.55007 ...
## mode                                             bicycle,...,train
Plotting the origins and destinations:
o <- st_apply(odm, 1, sum)
d <- st_apply(odm, 2, sum)
x <- (c(o, d, along = list(od = c("origin", "destination"))))
plot(x, logz = TRUE)
