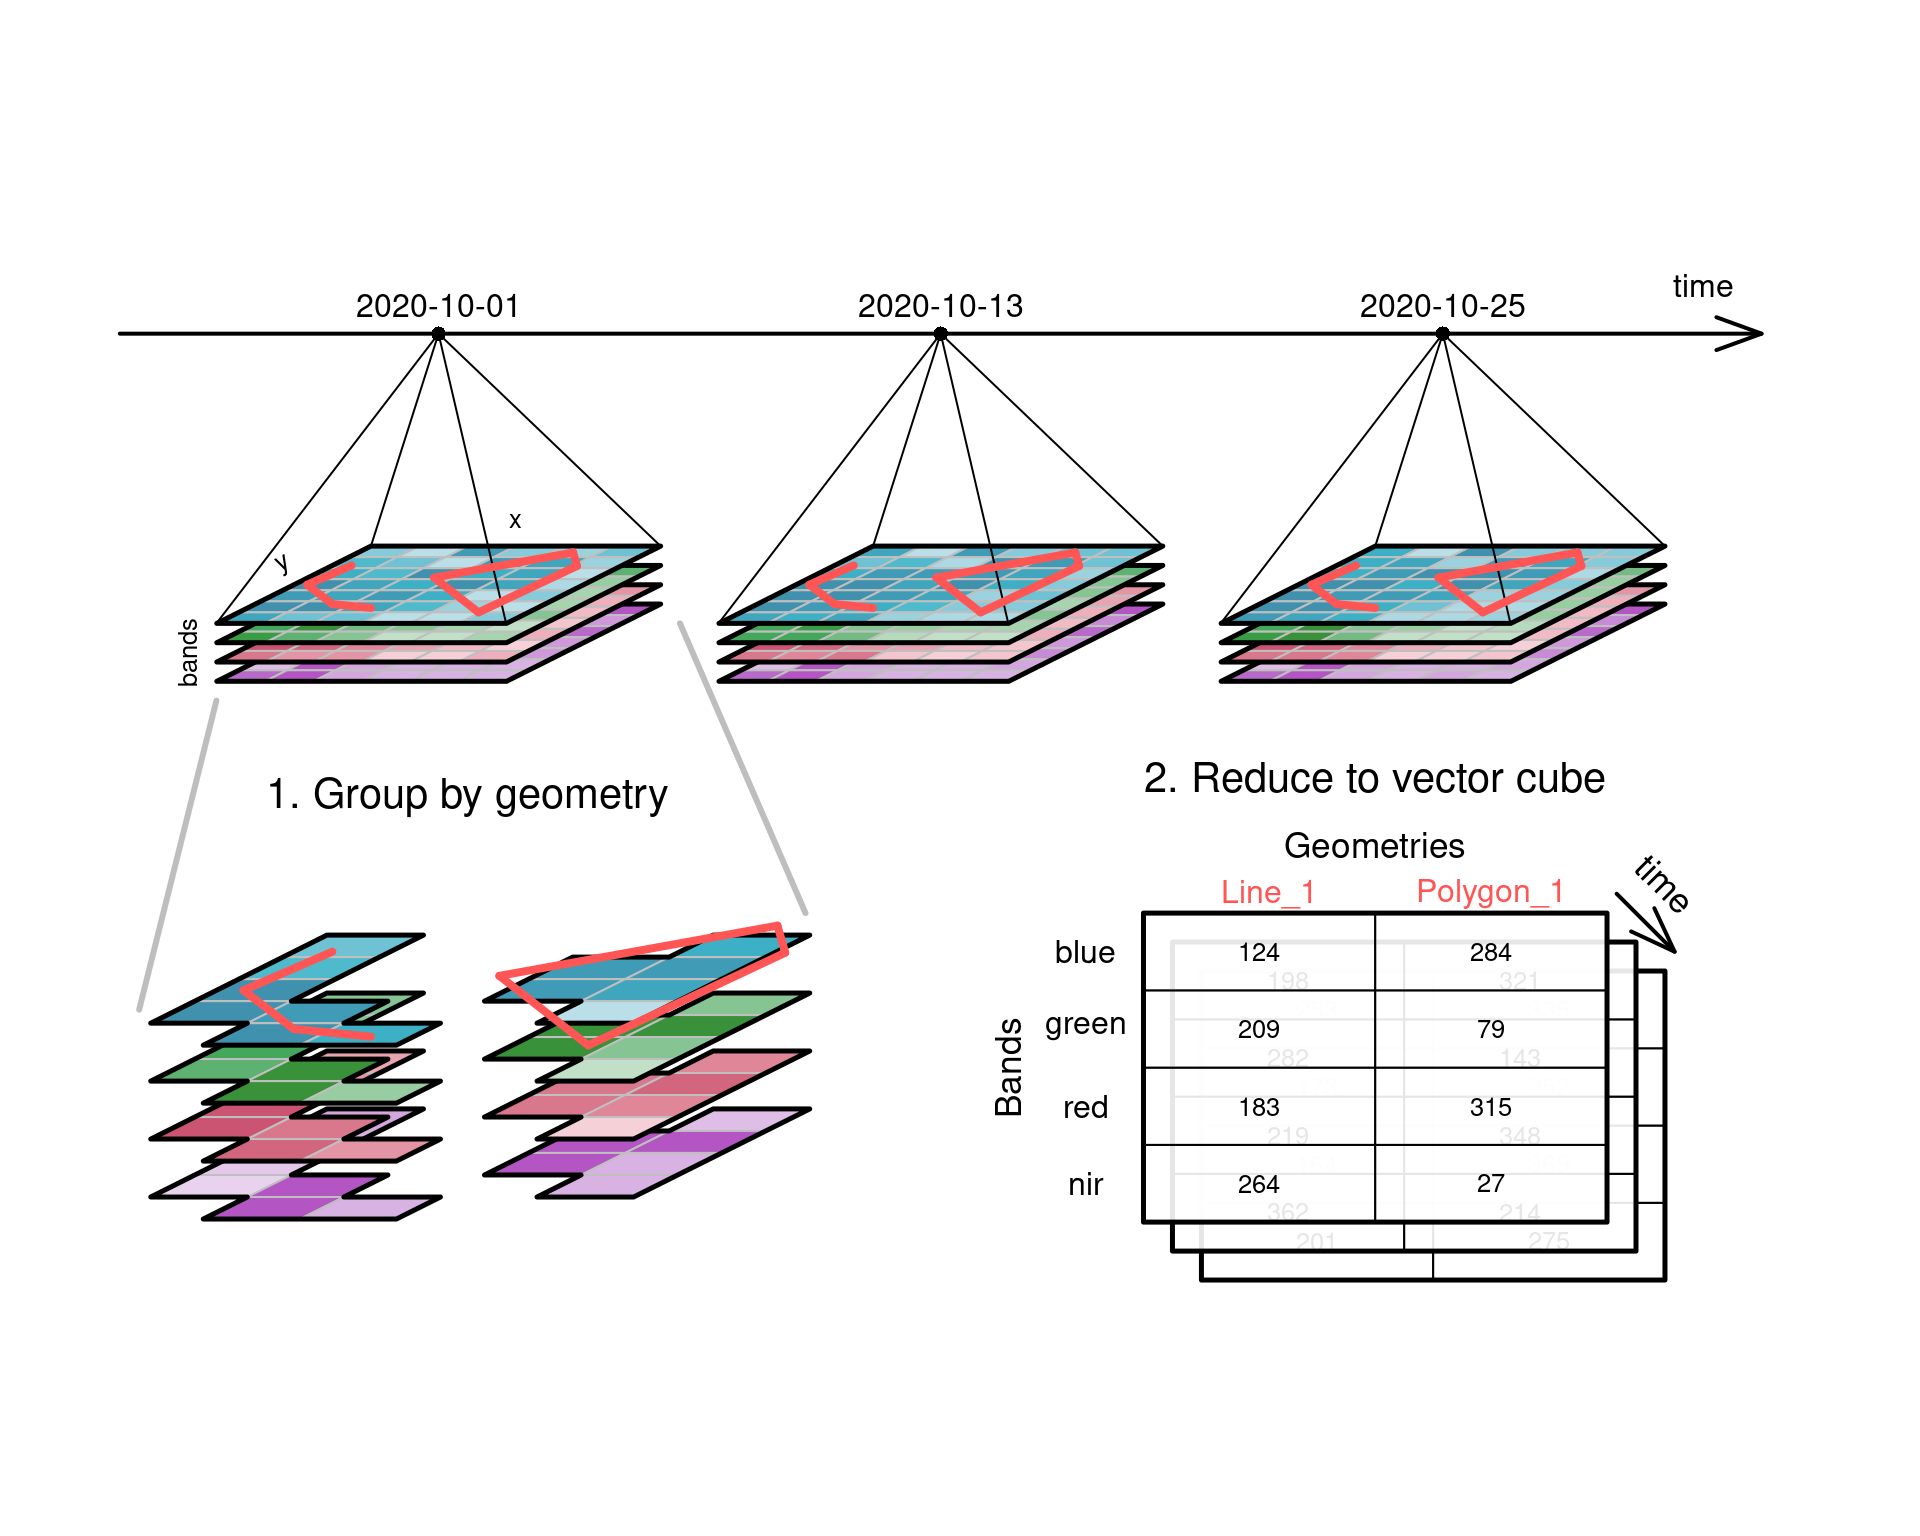
Aggregating raster to vector cubes
- We can start with a four-dimensional data cube and aggregate (reduce) it to a three-dimensional vector data cube:
- Pixels in the raster are grouped by spatial intersection with a set of vector geometries, and each group is then reduced to a single value by an aggregation function such as
mean or max.

- Examples of vector data cubes are:
- air quality data with \(PM_{10}\) over two dimensions, as a sequence of monitoring stations or time intervals,
- demographic data consisting of counts, with number of persons by regions for a sequence of n regions, age class, for m age classes, and year for p years. This would create an array with nmp elements.
- Examples of changing dimensions:
- interpolating air quality measurements to values on a regular grid,
- estimating number of flights passing by per week within a range of 1 km,
- combining Earth observation data form different sensors such as MODIS (250-m pixels every 16 days) with Sentinel-2 (10-m pixels every 5 days).
- Examples of aggregating one or more dimensions:
- which air quality monitoring stations indicate unhealthy conditions (time),
- which region has the highest increase in disease incidence (space, time),
- global warming (global change in degrees Celsius per decade).
