Dimensions, attributes, and support
- Depending on the data that we are dealing with (discrete or continuous), we may have the following data structures:
- time series, depicted as time lines for functions of time
- image or raster data for two-dimensional spatial data
- time sequences of images for dynamic spatial data (spatio-temporal array or data cube)
- time series, depicted as time lines for functions of time
Here, a variable Z depends on x,y, and t. The variables from the range (x,y,t) are the cube dimensions.
\[ Z = f(x,y,t) \]
\[ \{ Z_1, Z_2, ..., Z_p \} = f(x,y,t) \]
And if we have multiple time dimensions then we represent each with \(D_x\). For example, when we are splitting time in years, day-of-year, hour-of-day.
\[ \{ Z_1, Z_2, ..., Z_p \} = f(D_1, D_2, ... , D_n) \]
We deal with datasets with one or more space dimensions and zero or more time dimensions as data cubes:
simple features
time series for sets of features
raster data
multi-spectral raster data (images)
time series of multi-spectral raster data (video)
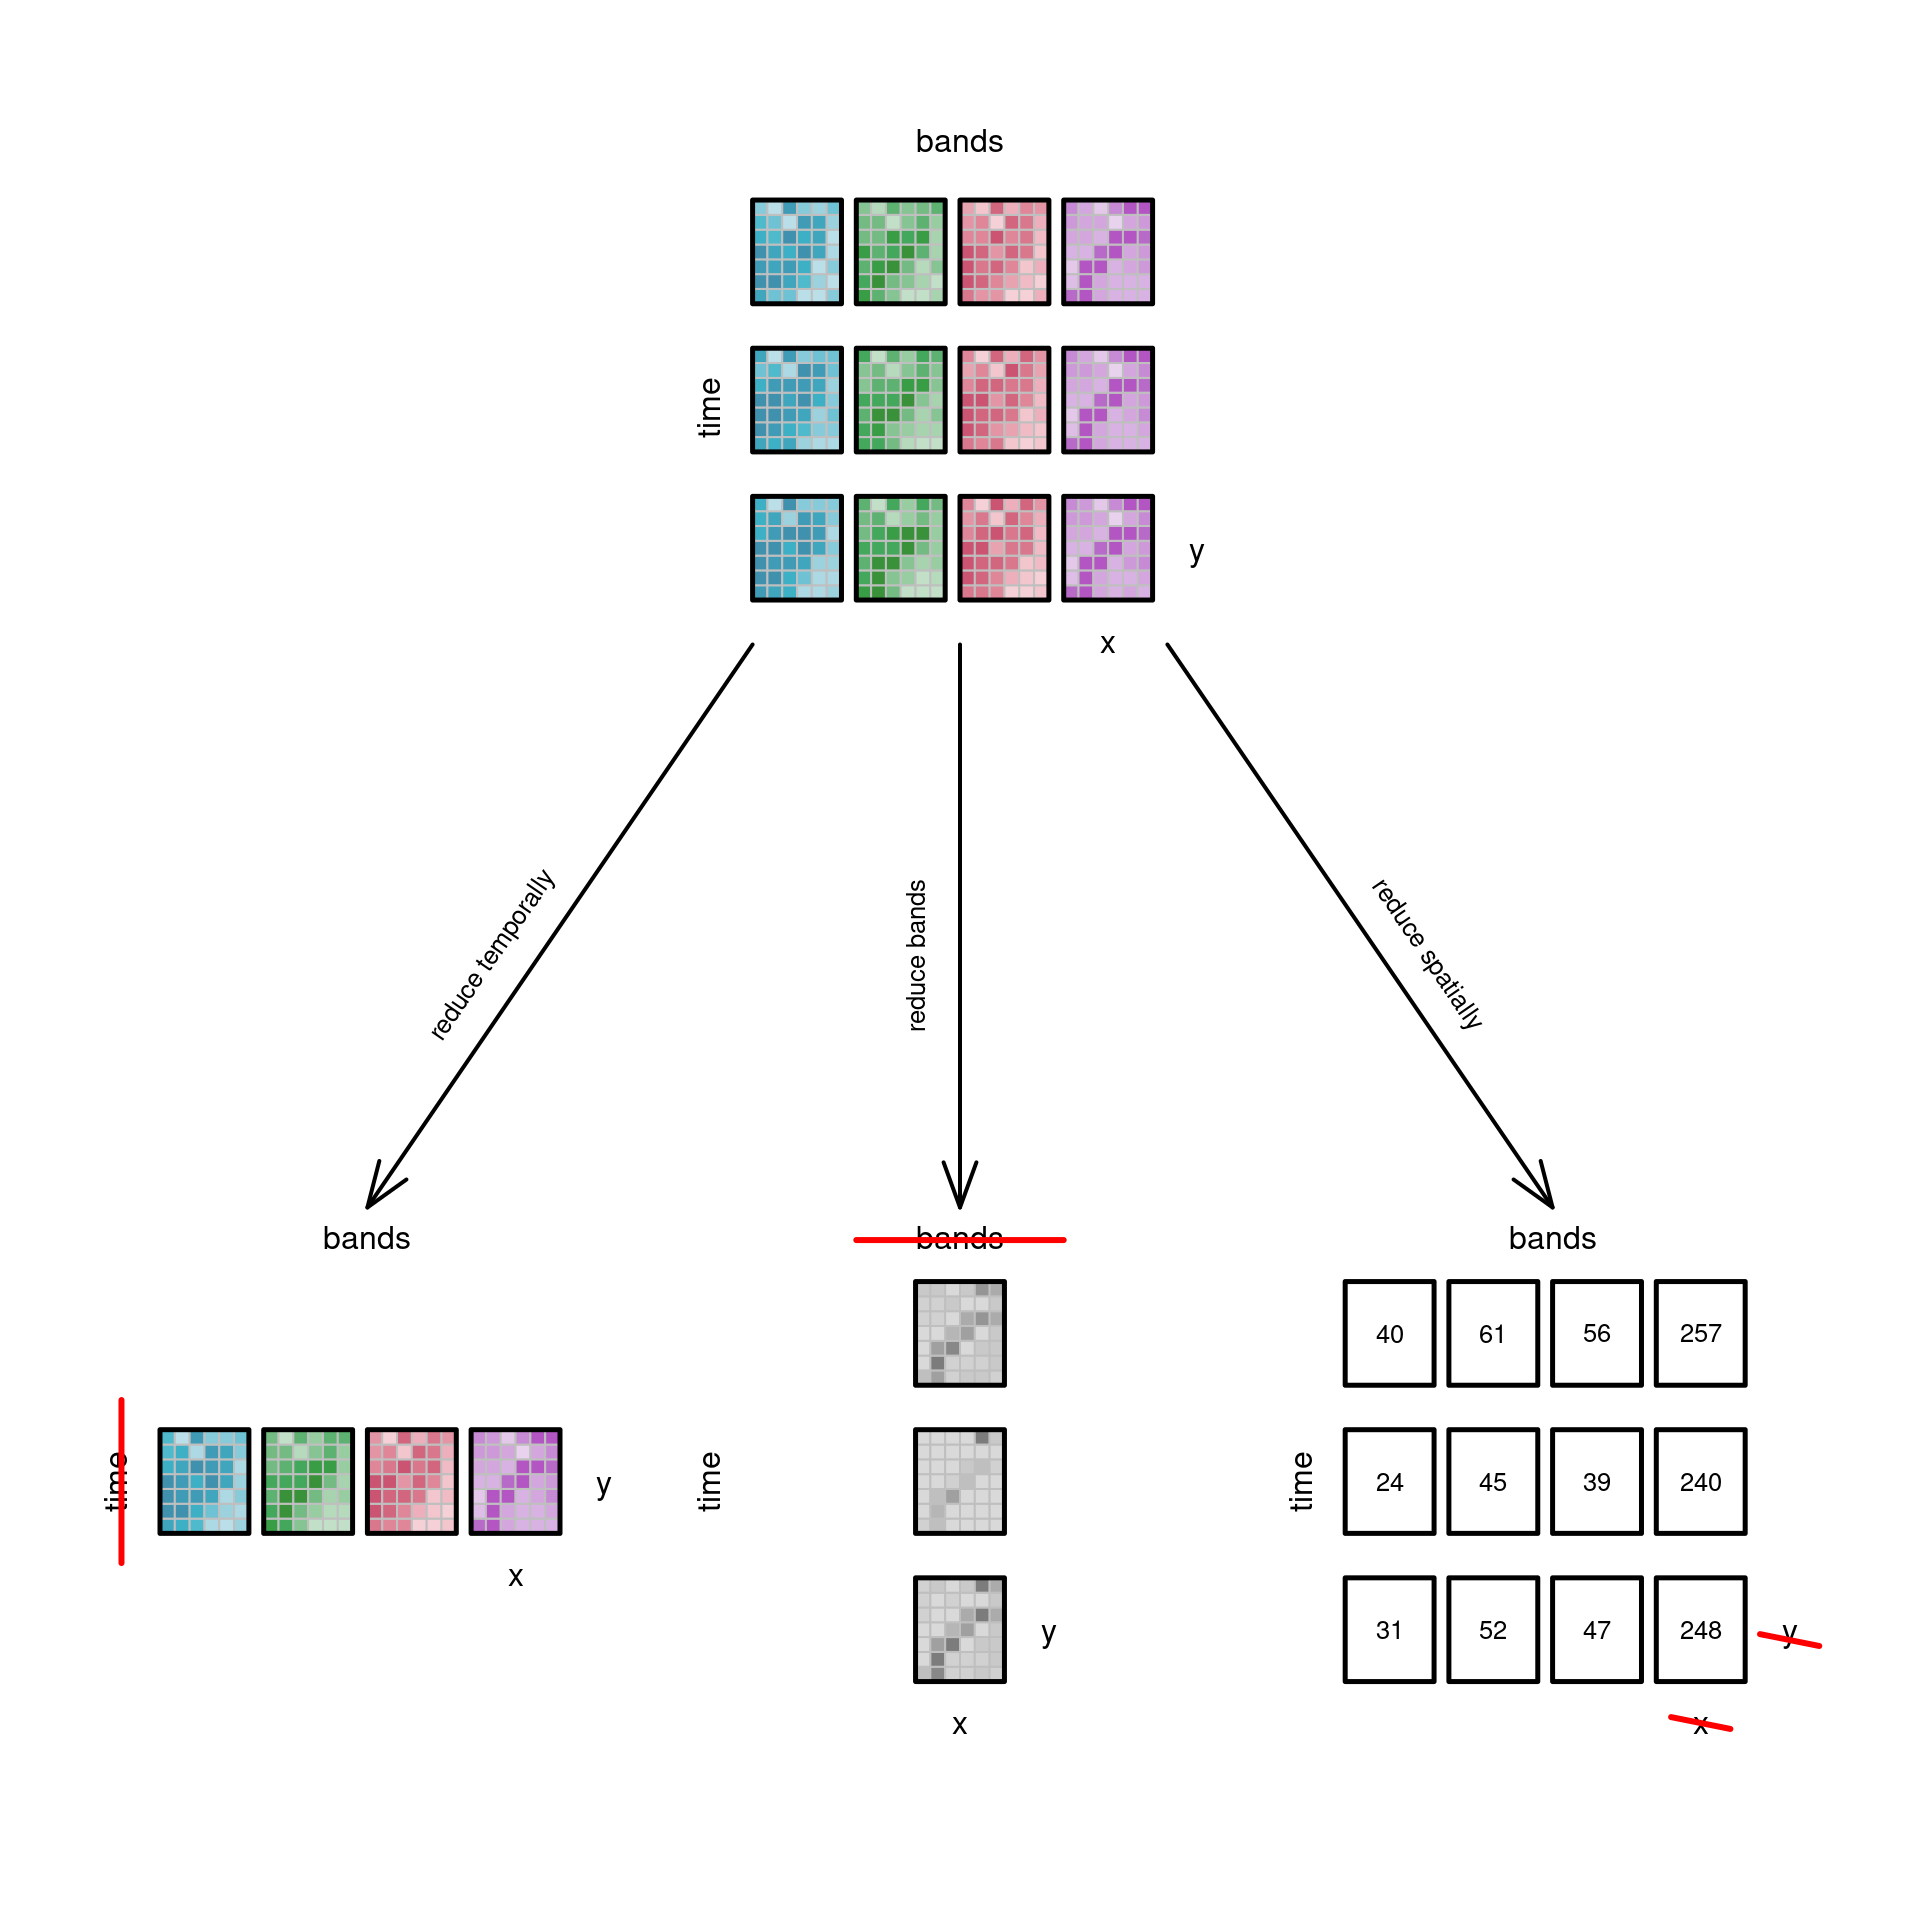
Operations on data cubes
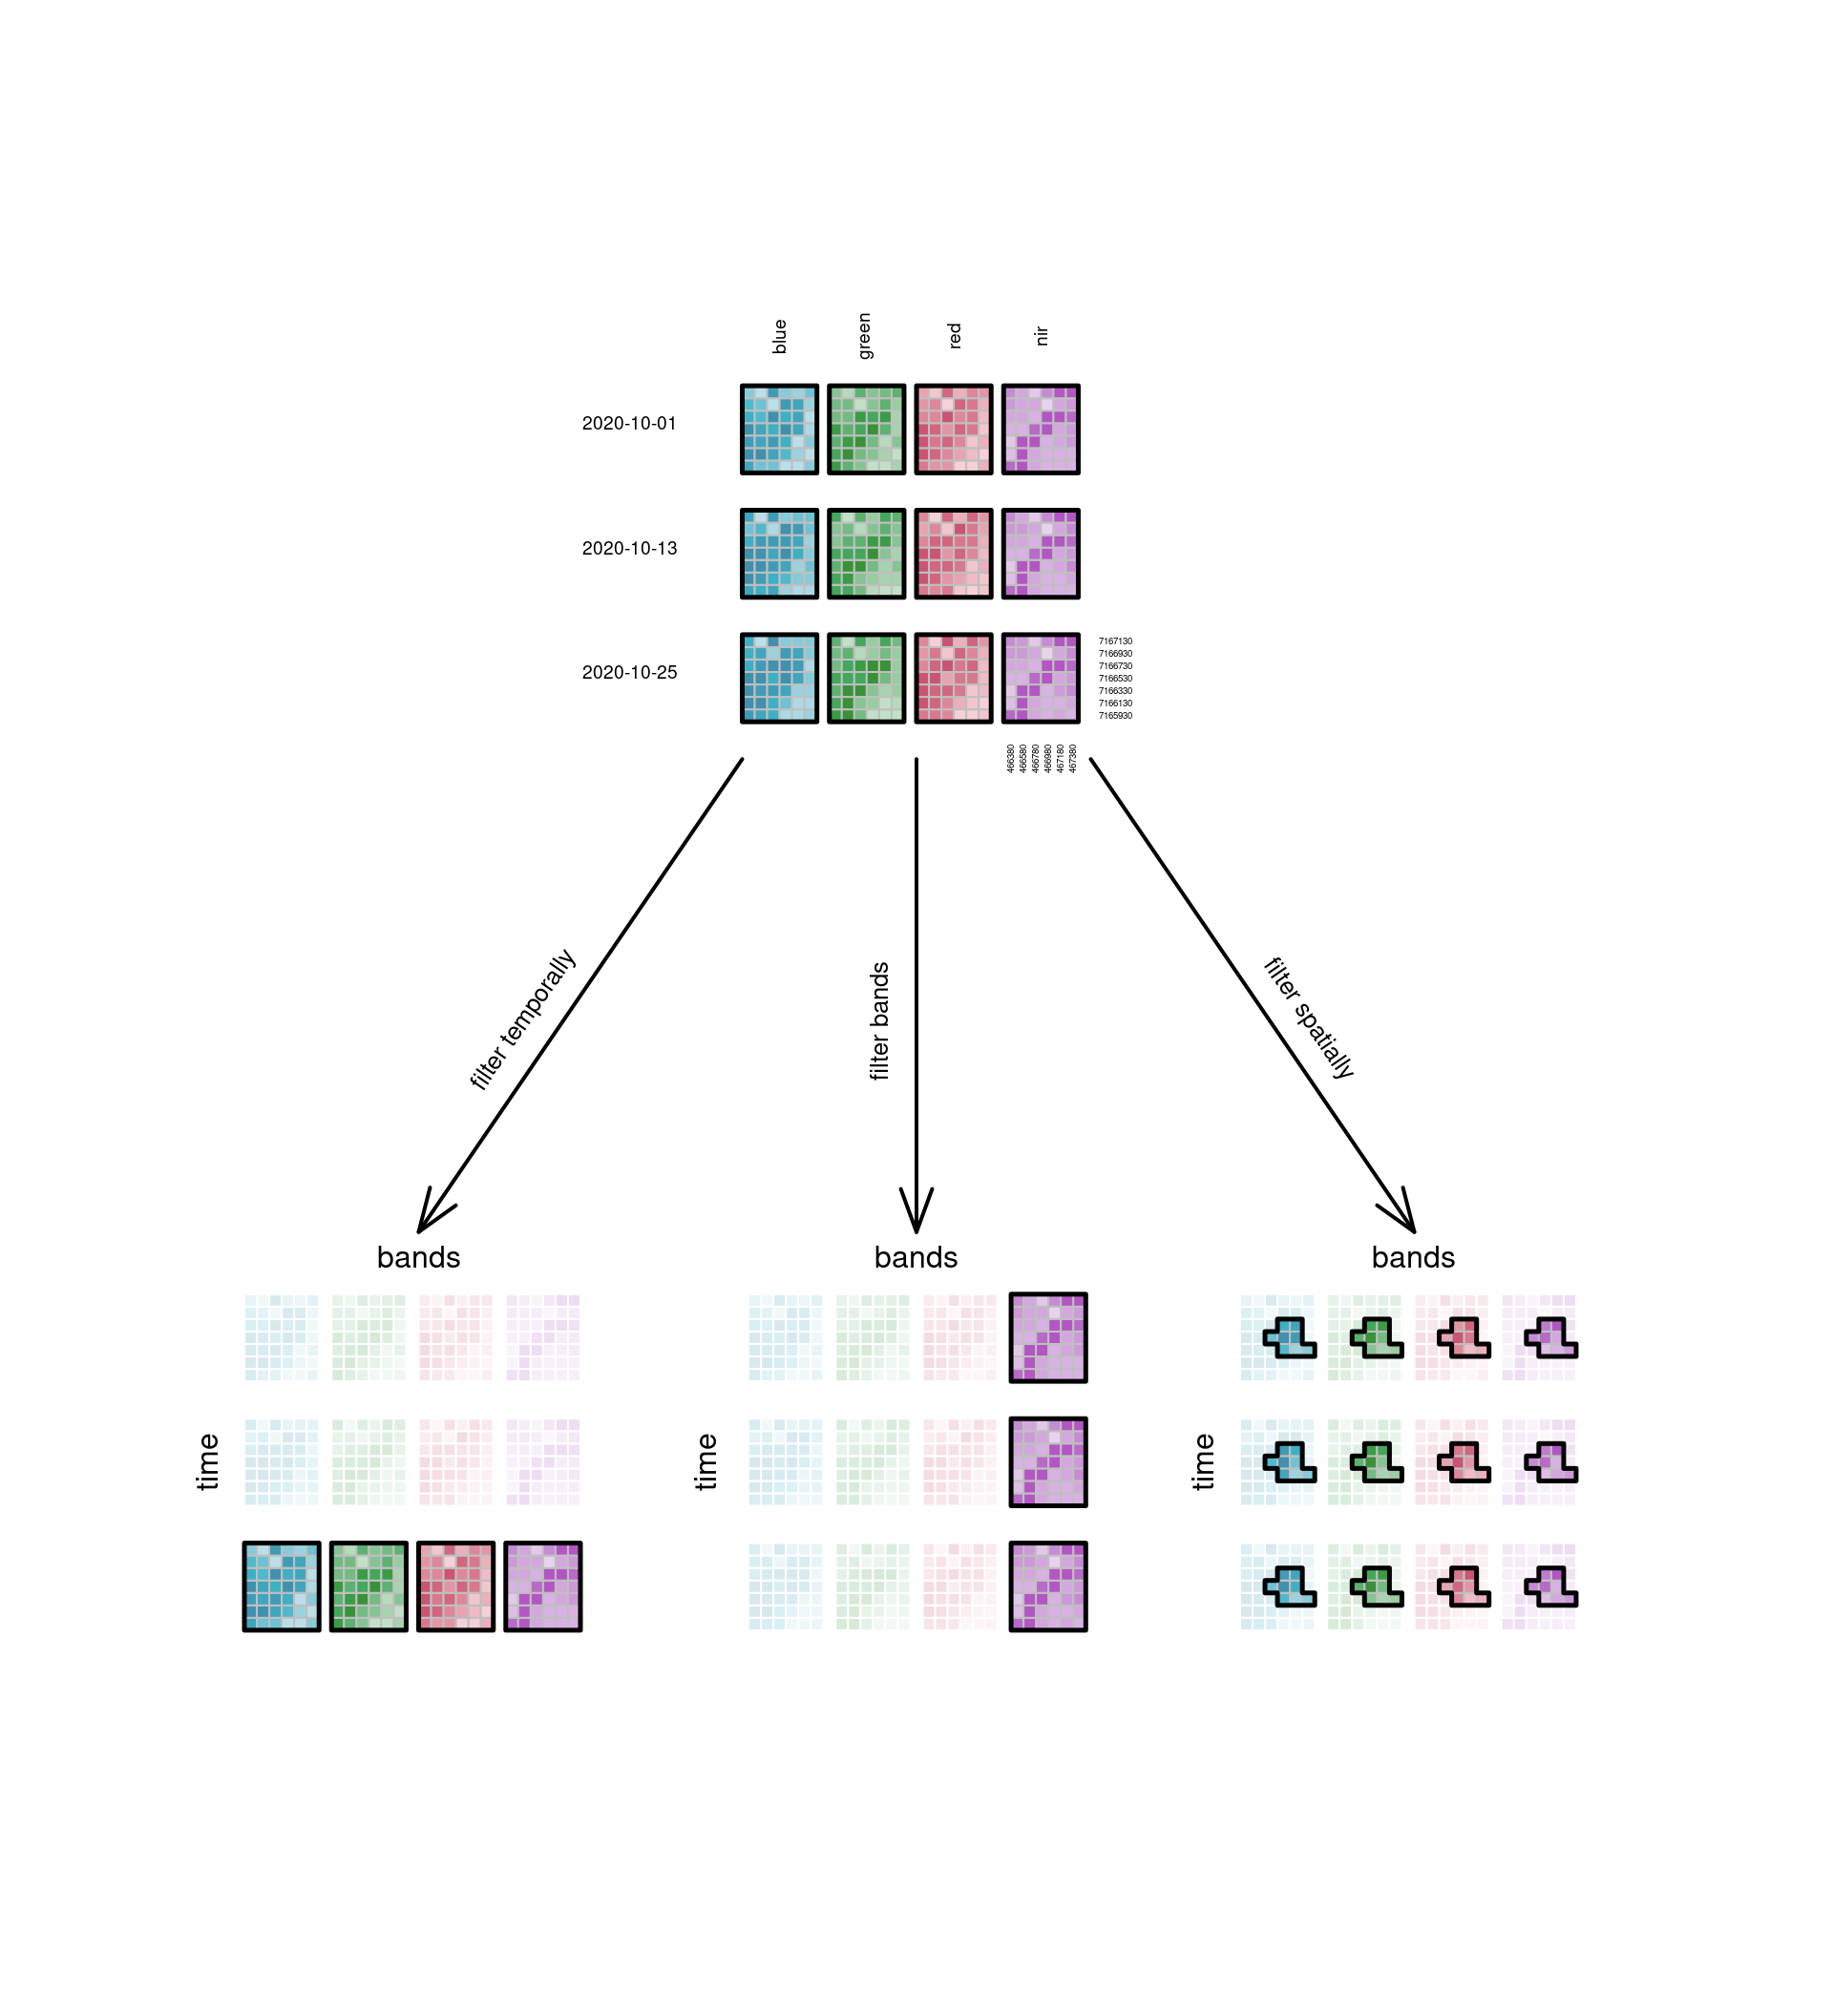
Slicing a cube: filter
- Data cubes can be sliced into sub-cubes by fixing a dimension at a particular value.

