7.8 Example: Olinda, Brazil
## stars object with 3 dimensions and 1 attribute
## attribute(s):
##              Min. 1st Qu. Median     Mean 3rd Qu. Max.
## L7_ETMs.tif     1      54     69 68.91242      86  255
## dimension(s):
##      from  to  offset delta                     refsys point x/y
## x       1 349  288776  28.5 SIRGAS 2000 / UTM zone 25S FALSE [x]
## y       1 352 9120761 -28.5 SIRGAS 2000 / UTM zone 25S FALSE [y]
## band    1   6      NA    NA                         NA    NA
attributes
from: starting indexto: ending indexoffset: dimension value at the start (edge) of the first pixeldelta: cell size; negative delta values indicate that pixel index increases with decreasing dimension valuesrefsys: reference systempoint: logical, indicates whether cell values have point support or cell supportx/y: indicates whether a dimension is associated with a spatial raster x- or y-axis
7.8.1 Plots

par(mfrow = c(1, 2))
plot(r, rgb = c(3,2,1), reset = FALSE, main = "RGB")    # rgb
plot(r, rgb = c(4,3,2), main = "False colour (NIR-R-G)") # false colour
7.8.2 Subsetting
Example: selects from r
- attributes 1-2, index 101-200 for dimension 1, and index 5-10 for dimension 3
- omitting dimension 2 means that no subsetting takes place
Selecting discontinuous ranges is supported only when it is a regular sequence
##    x    y band
## 100 50 1## x y
## 100 50For selecting particular ranges of dimension values, one can use dplyr::filter
## stars object with 3 dimensions and 1 attribute
## attribute(s):
##              Min. 1st Qu. Median    Mean 3rd Qu. Max.
## L7_ETMs.tif     5      51     63 64.3337      75  242
## dimension(s):
##      from  to  offset delta                     refsys point x/y
## x       1  35  289004  28.5 SIRGAS 2000 / UTM zone 25S FALSE [x]
## y       1 352 9120761 -28.5 SIRGAS 2000 / UTM zone 25S FALSE [y]
## band    1   6       1     1                         NA    NA
or slice
## stars object with 2 dimensions and 1 attribute
## attribute(s):
##              Min. 1st Qu. Median     Mean 3rd Qu. Max.
## L7_ETMs.tif    21      49     63 64.35886      77  255
## dimension(s):
##   from  to  offset delta                     refsys point x/y
## x    1 349  288776  28.5 SIRGAS 2000 / UTM zone 25S FALSE [x]
## y    1 352 9120761 -28.5 SIRGAS 2000 / UTM zone 25S FALSE [y]
7.8.3 Cropping
## stars object with 3 dimensions and 1 attribute
## attribute(s):
##              Min. 1st Qu. Median     Mean 3rd Qu. Max. NA's
## L7_ETMs.tif    22      54     66 67.68302   78.25  174 2184
## dimension(s):
##      from  to  offset delta                     refsys point x/y
## x     157 193  288776  28.5 SIRGAS 2000 / UTM zone 25S FALSE [x]
## y     159 194 9120761 -28.5 SIRGAS 2000 / UTM zone 25S FALSE [y]
## band    1   6      NA    NA                         NA    NA
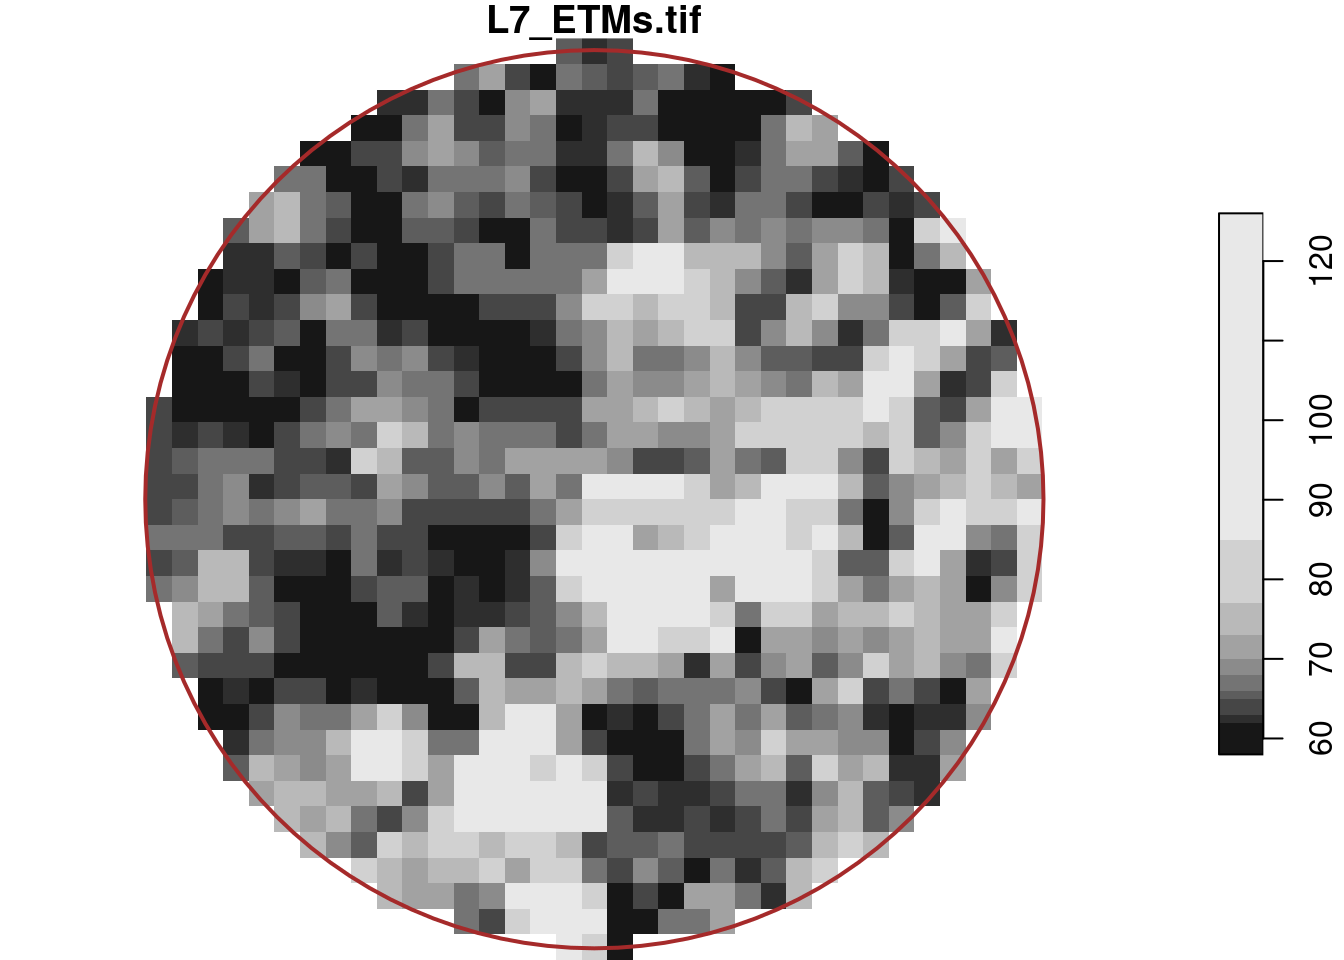
Circular centre region of the Landsat 7 scene (band 1)
image code
By default, the resulting raster is cropped to the extent of the selection object; otherwise
## stars object with 3 dimensions and 1 attribute
## attribute(s):
##              Min. 1st Qu. Median     Mean 3rd Qu. Max.   NA's
## L7_ETMs.tif    22      54     66 67.68302   78.25  174 731280
## dimension(s):
##      from  to  offset delta                     refsys point x/y
## x       1 349  288776  28.5 SIRGAS 2000 / UTM zone 25S FALSE [x]
## y       1 352 9120761 -28.5 SIRGAS 2000 / UTM zone 25S FALSE [y]
## band 1 6 NA NA NA NA## from to offset delta refsys point x/y
## x 1 37 293222 28.5 SIRGAS 2000 / UTM zone 25S FALSE [x]
## y 1 36 9116258 -28.5 SIRGAS 2000 / UTM zone 25S FALSE [y]
## band 1 6 NA NA NA NAor simply using the stars function made for cropping