NHST
Null Hypothesis Significance Testing
- Step 1: Define null and alternative hypotheses
\[\begin{array}{rrcl} H_{0}: & \mu & = & 35000 \\ H_{0}: & \mu & \neq & 35000 \\ \end{array}\]
- Step 2: Pick a test statistic with a known distribution. Here: bootstrap null distribution
bootstrap_distribution <- scorecard |>
  specify(response = amnt_earnings_med_10y) |>
  hypothesize(null = "point", mu = 35000) |>
  generate(reps = 1000, type = "bootstrap") |>
calculate(stat = "mean")- Step 3: Get that same test statistic in the data
- Step 4: How likely to get observed value (or more extreme)?
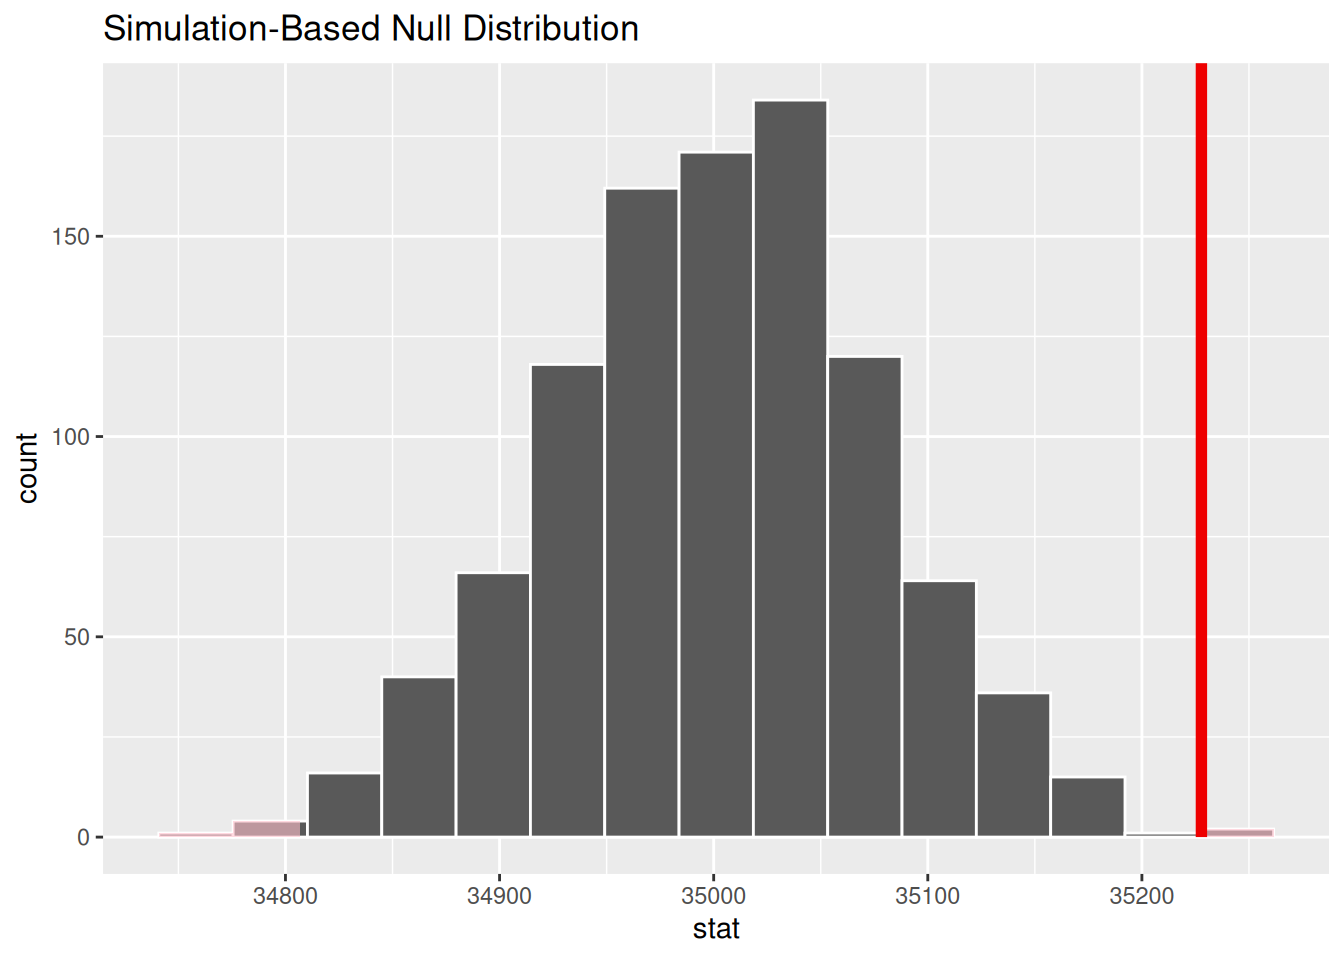
## # A tibble: 1 × 1
##   p_value
##     <dbl>
## 1   0.004
Step 5: Determine whether we can reject the null hypothesis.
- Since p-value \(< 0.05\), we reject the null hypothesis that the average median salary for college cohorts (10 years after graduation) is $35k (at the \(\alpha = 0.05\) level)
- not a statement of correct or incorrect
- we reject this particular bootstrap distribution