The Effect: An Introduction to Research Design and Causality Book Club
Introduction
Book club meetings
Pace
Introductions
git and GitHub
Group Question 1
Group Question 2
Group Question 3
git and GitHub Resources
Learning objectives
Today’s learning objectives
1
Designing Research
Research Questions
Empirical Research
Why Research needs a design
Book Goals
Discussion/Practicals
Meeting Videos
Cohort 1
2
Research Questions
What is a Research Question?
Data Mining vs. Research Q’s
Considerations for a good Research Q
Discussion/Practicals
Meeting Videos
Cohort 1
3
Describing Variables
3.1
Overview
3.2
Variable types
3.3
Distribution
3.4
Summarizing the distribution
3.5
Mean, Percentiles, IQR
3.6
Variation
3.7
Skew
3.8
Theoretical Distributions
Meeting Videos
Cohort 1
4
Describing Relationships
4.1
Relationships
4.2
Conditional distributions
4.3
Conditional means
4.4
Line-fitting/regression
4.5
Conditional Conditional Means (not a typo) AKA using controls
Meeting Videos
Cohort 1
5
Identification
5.1 The Data Generating Process
Introduction
Two Parts of DGPs
Contrived DGP Example
Two core ideas
5.2 Where’s Your Variation?
Avocado Prices Overview
Example Answers to Above Questions
DGP and Isolating Variation in Avocados Example
Broad ideas
5.3 Identification
Example of Family Dog, Rex, Escaping House
Identification Process
5.4 Alcohol and Mortality
Overview
Study Findings
Book Exercise
Example Answers
Issues with Causal Explanation
Controls in Study to Address Alternate Explanations
Lingering Issues
5.5 Context and Omniscience
Meeting Videos
Cohort 1
6
Causal Diagrams
SLIDE 1
Meeting Videos
Cohort 1
7
Drawing Causal Diagrams
SLIDE 1
Meeting Videos
Cohort 1
8
Causal Paths and Closing Back Doors
8.1
Paths
8.2
Finding all paths
8.3
Solution
8.4
Let’s try another one: Wine and Health
8.5
Solution
8.6
Path types
8.7
Closing paths
8.8
Colliders
8.9
Using paths to test the DAG
Meeting Videos
Cohort 1
9
Finding Front Doors
SLIDE 1
Meeting Videos
Cohort 1
10
Treatment Effects
SLIDE 1
Meeting Videos
Cohort 1
11
Causality with Less Modeling
SLIDE 1
Meeting Videos
Cohort 1
12
Opening the Toolbox
12.1
Methods that we’ll be checking out
12.2
Structure of upcoming chapters
Meeting Videos
Cohort 1
13
Regression
13.1
Basics
13.2
Error terms
13.3
Regression assumptions
13.4
Sampling variation
13.5
Hypothesis testing in OLS
13.6
Mantras about hypothesis testing
13.7
Regression tables
13.7.1
Interpretation
13.7.2
Controls
13.8
Subscripts in regression equations
13.9
DAG to Regression
13.10
Getting fancier
13.11
Binary/discrete variables
13.12
Polynomials
13.13
Variable transformation
13.13.1
Options
13.13.2
Interpretation of log
13.14
Interaction terms
13.15
Nonlinear regressions
13.15.1
good link functions
13.15.2
Interpretation
13.16
Standard errors
13.16.1
Assumptions
13.16.2
Fixes (mostly sandwich estimators)
13.16.3
Bootstrapping
13.17
Sample Weights
13.18
Collinearity
13.19
Measurement error
13.20
Penalized regression
Meeting Videos
Cohort 1
14
Matching
SLIDE 1
Meeting Videos
Cohort 1
15
Simulation
SLIDE 1
Meeting Videos
Cohort 1
16
Fixed Effects
SLIDE 1
Meeting Videos
Cohort 1
17
Event Studies
17.1
How does it work?
17.2
Prediction and Deviation
17.3
Terminology
17.4
How it’s used in Finance
17.5
How it’s used with regressions
17.5.1
Example: Improved ambulance care
17.6
How it’s used when taking time series seriously
17.7
Forecasting with Time Series Models
17.8
Joint tests
Meeting Videos
Cohort 1
18
Difference-in-Differences
SLIDE 1
Meeting Videos
Cohort 1
19
Instrumental Variables
19.1
How does it work?
19.2
Assumptions
19.3
Canonical designs
19.4
Instrumental Variables estimator
19.5
Example: Insurance takeup
19.5.1
2SLS
19.5.2
GMM
19.6
IV and treatment effects
19.7
Checking IV assumptions
19.8
How the Pros do it
19.9
Don’t just test for weakness, fix it
19.10
Way past LATE
19.11
Nonlinear IV
19.12
Validity violation
Meeting Videos
Cohort 1
20
Regression Discontinuity
SLIDE 1
Meeting Videos
Cohort 1
21
A Gallery of Rogues: Other Methods
SLIDE 1
Meeting Videos
Cohort 1
22
Under the Rug
SLIDE 1
Meeting Videos
Cohort 1
Published with bookdown
The Effect: An Introduction to Research Design and Causality Book Club
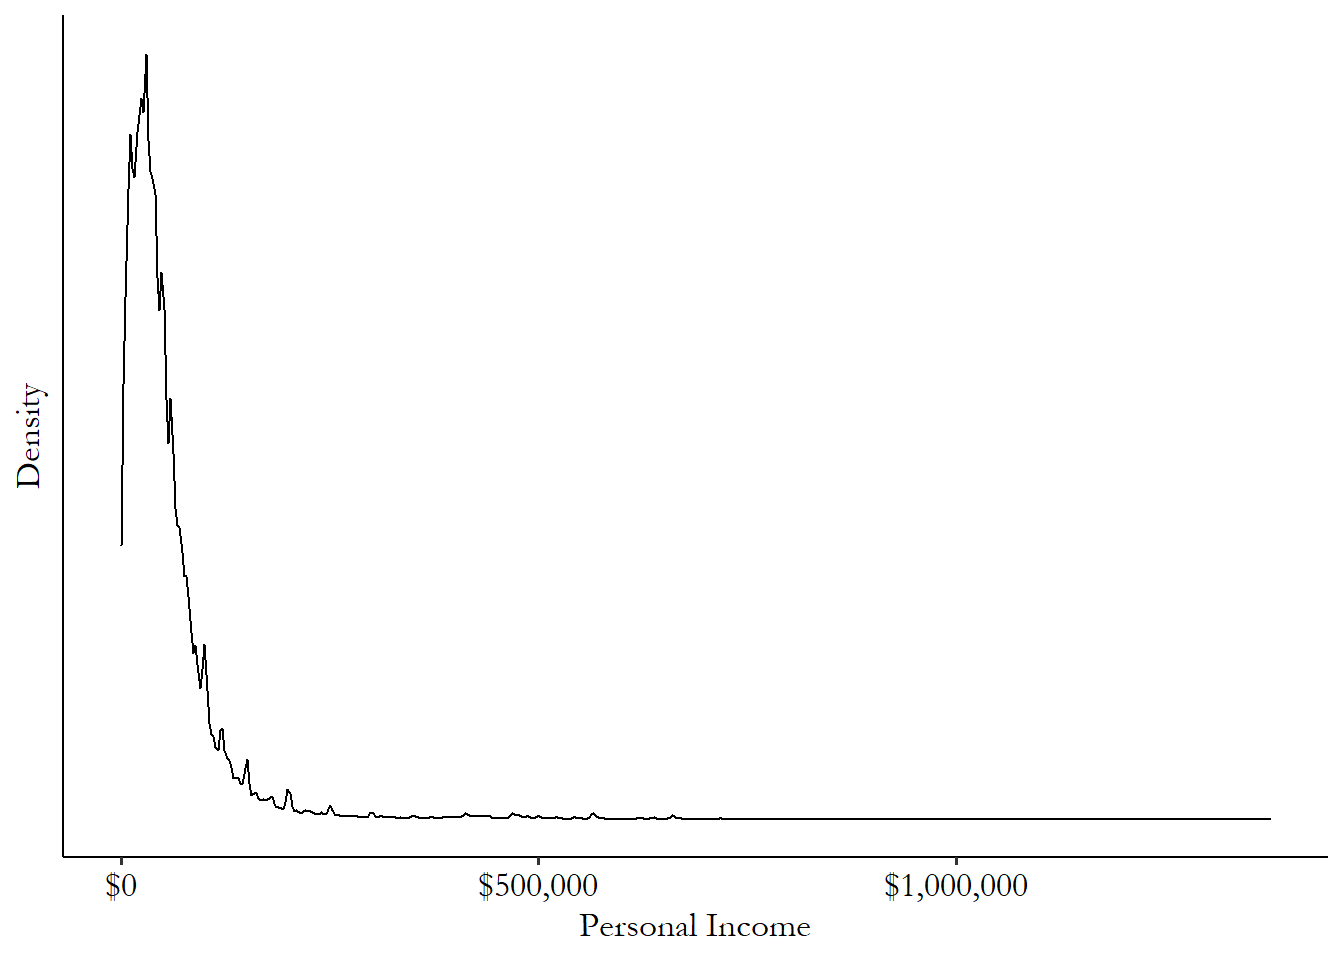
3.7
Skew
describes how the distribution leans to one side or the other; opposite: symmetric
Handling: transformation to shrink impact of huge observations - e.g. log (no 0s) - asinh (with 0s, but no negative values)