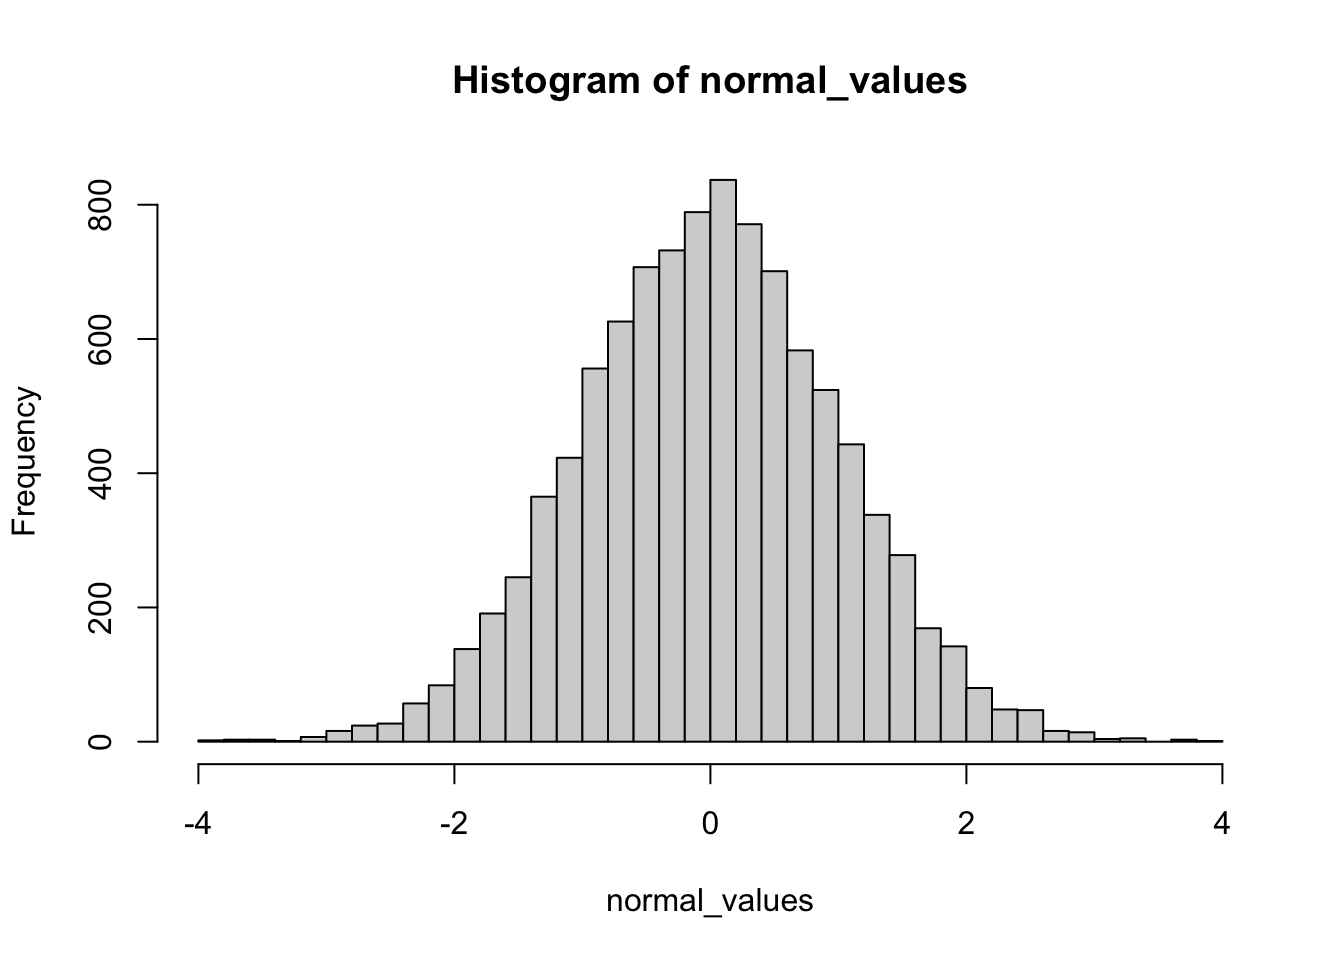
normal_values <- rnorm(n = 10000)

hist(normal_values, breaks = 30)
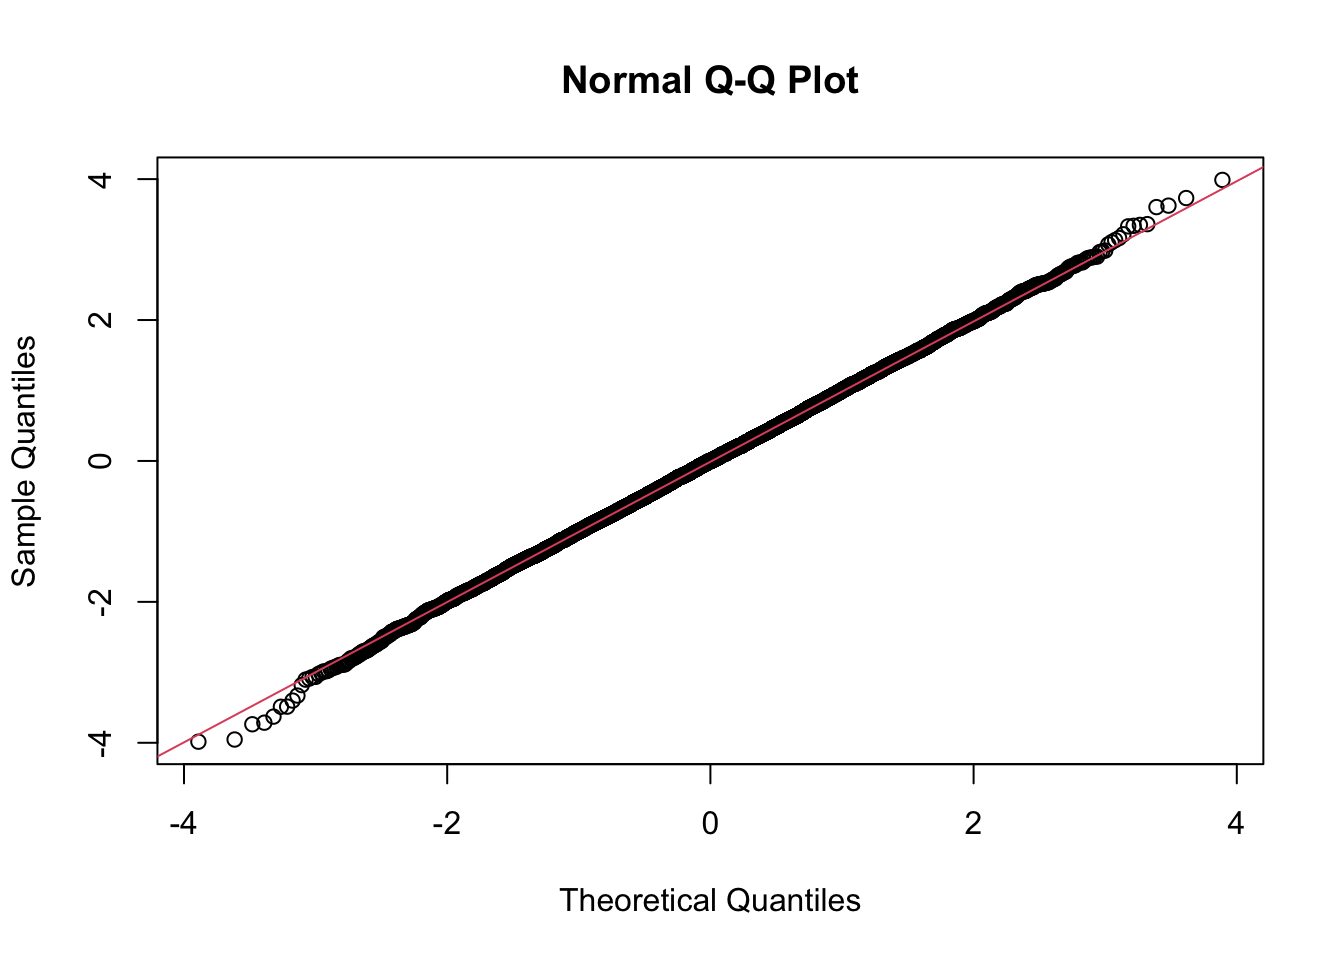
# qqnorm plots the location of quantiles of the given distribution
# vs locations of corresponding quantiles of normal distribution.

qqnorm(normal_values); qqline(normal_values, col = 2)