Correlation
## corrplot 0.90 loaded
library(dplyr, quietly = TRUE)
##
## Attaching package: 'dplyr'
## The following objects are masked from 'package:stats':
##
##     filter, lag
## The following objects are masked from 'package:base':
##
##     intersect, setdiff, setequal, union
sp500_px <- read.csv("data/sp500_data.csv.gz") %>%
as_tibble()
sp500_sym <- read.csv("data/sp500_sectors.csv", stringsAsFactors = FALSE) %>%
as_tibble()
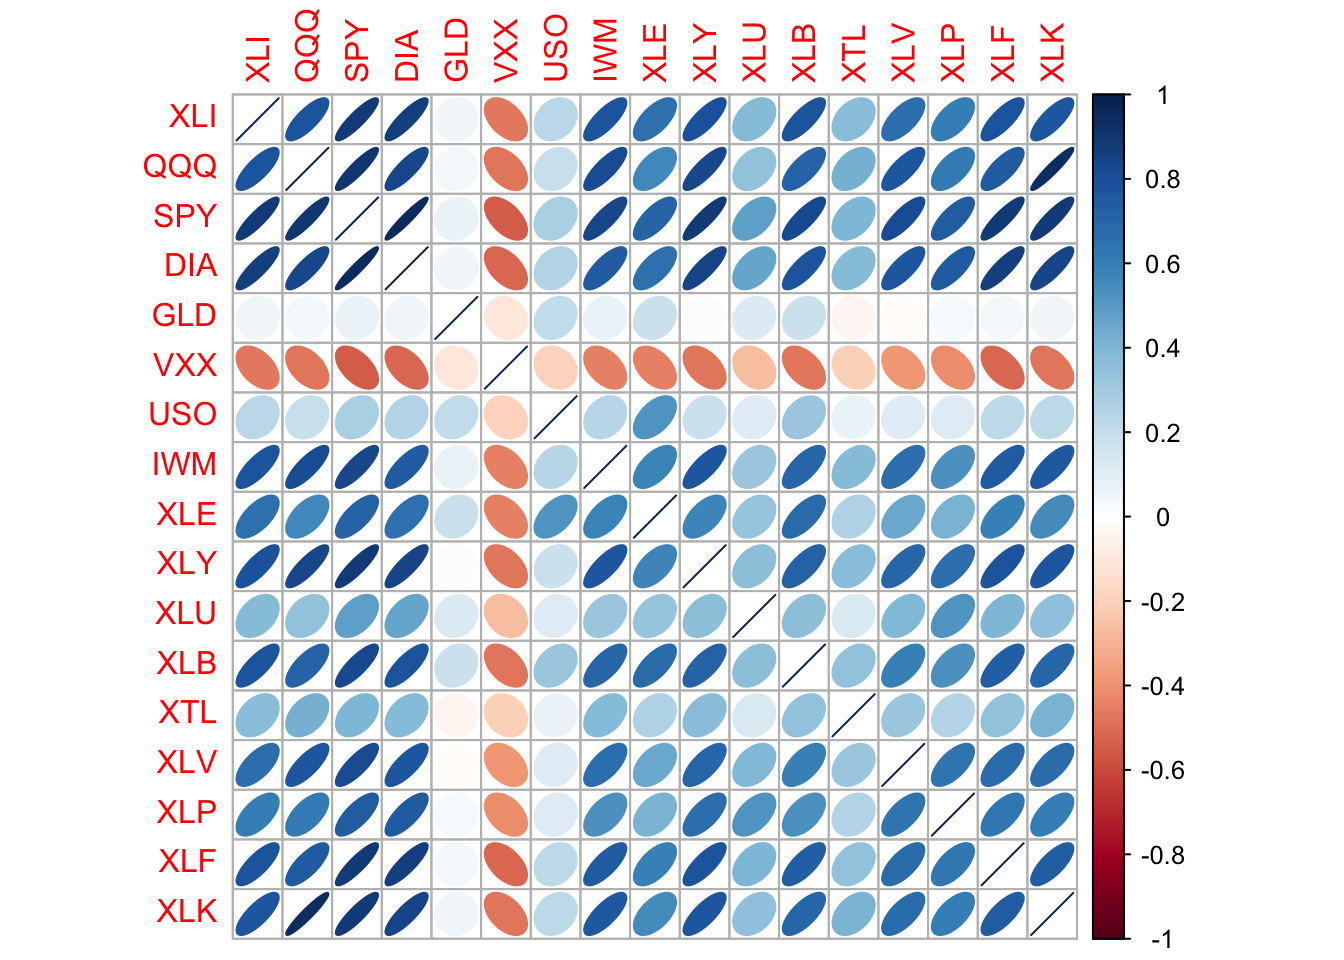
etfs <- sp500_px %>%
filter(X > "2012-07-01") %>%
select(
any_of(
sp500_sym %>%
filter(sector == "etf") %>%
pull(symbol)
)
)
corrplot(cor(etfs), method = "ellipse")