ROC Curves
- Stands for “Receiver Operating Characteristics,” but that’s really just trivia.
- The book has the x-axis backwards, which is bonkers.
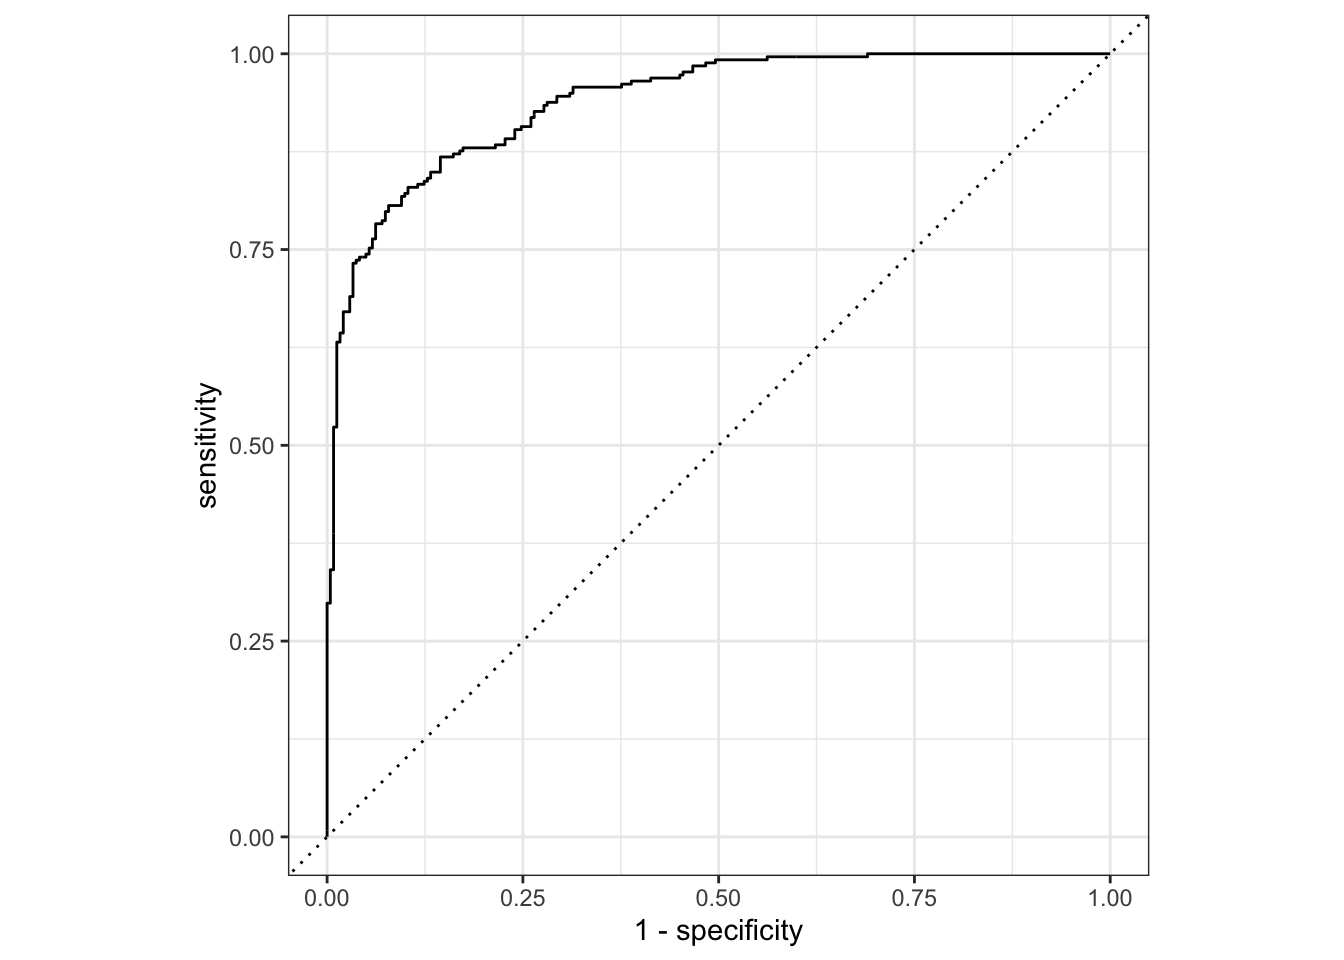
yardstick::roc_curve constructs a tibble of data for the ROC curve, and can be autoplotted to generate the curve.
## For binary classification, the first factor level is assumed to be the event.
## Use the argument `event_level = "second"` to alter this as needed.
library(ggplot2)

data(two_class_example)
autoplot(roc_curve(two_class_example, truth, Class1))
- AUC (
yardstick::roc_auc()) = area under the ROC curve.
- 1 = perfect, 0.5 = random chance