The Ideal Solution
The resulting sampling distribution of the statistic would help us understand the results of our sampling experiment.
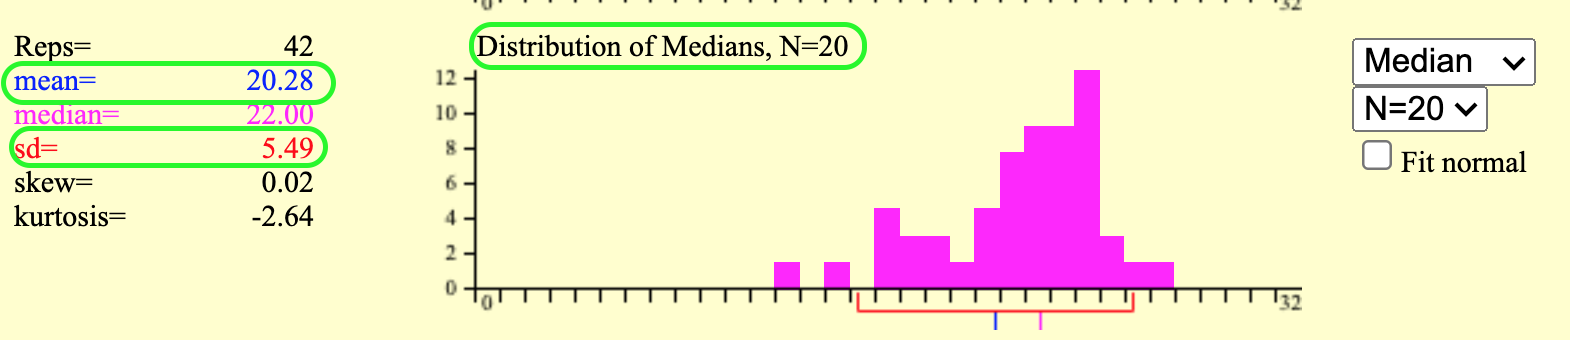
- The mean of the sampling distribution is (an estimate of) the value of the statistic that our experiment is “aiming at.”4
- The standard deviation of the distribution is (an estimate of) how much random fluctuations are likely to influence our measurement. This is also known as the standard error of our calculated sample statistic.
This may not be equal to the population statistic, due to sample size bias. For example, if my target statistic is the range of some variable, the sample statistic will always be less than or equal to the population statistic. And so the mean of the sampling distribution for the range will be less than the population range. Some statistics, like the mean, are known to be unbiased statistics, while others are known to be biased.↩︎