5.3 Standardized incidence ratio
Estimation of the disease risk estimates in each of the areas
\[SIR_i=\frac{Y_i}{E_i}\] \(E_i\) is the expected counts or the expected total number of cases, is the sum of the multiplication of the rate of the number of cases divided by population in \(j\) \(r_j^{(s)}\), and \(n_j^{(i)}\) the population in stratum \(j\) of area \(i\).
\[E_i=\sum_{j=1}^m{r_{j}^{(s)}n_{j}^{(i)}}\]
\[SIR_i=\begin{Bmatrix} >1 & \text{higher} \\ =1 & \text{equal} \\ <1 & \text{lower} \end{Bmatrix} \text{risk than expected in area i}\]
When applied to mortality data, the ratio is known as the standardized mortality ratio (SMR).
Example:
d <- pennLC$data%>%
  group_by(county) %>%
  summarize(Y = sum(cases))

head(d)
## # A tibble: 6 × 2
## county Y
## <fct> <int>
## 1 adams 55
## 2 allegheny 1275
## 3 armstrong 49
## 4 beaver 172
## 5 bedford 37
## 6 berks 308pennLC$data <- pennLC$data %>%
arrange(county,race,gender,age)E <- expected(
population = pennLC$data$population,
cases = pennLC$data$cases, n.strata = 16
)d$E <- E[match(d$county, unique(pennLC$data$county))]
head(d)## # A tibble: 6 × 3
## county Y E
## <fct> <int> <dbl>
## 1 adams 55 69.6
## 2 allegheny 1275 1182.
## 3 armstrong 49 67.6
## 4 beaver 172 173.
## 5 bedford 37 44.2
## 6 berks 308 301.d$SIR <- d$Y / d$Ehead(d)## # A tibble: 6 × 4
## county Y E SIR
## <fct> <int> <dbl> <dbl>
## 1 adams 55 69.6 0.790
## 2 allegheny 1275 1182. 1.08
## 3 armstrong 49 67.6 0.725
## 4 beaver 172 173. 0.997
## 5 bedford 37 44.2 0.837
## 6 berks 308 301. 1.02map <- merge(map, d)mapsf <- st_as_sf(map)ggplot(mapsf) + geom_sf(aes(fill = SIR)) +
scale_fill_gradient2(
midpoint = 1, low = "blue", mid = "white", high = "red"
) +
theme_bw()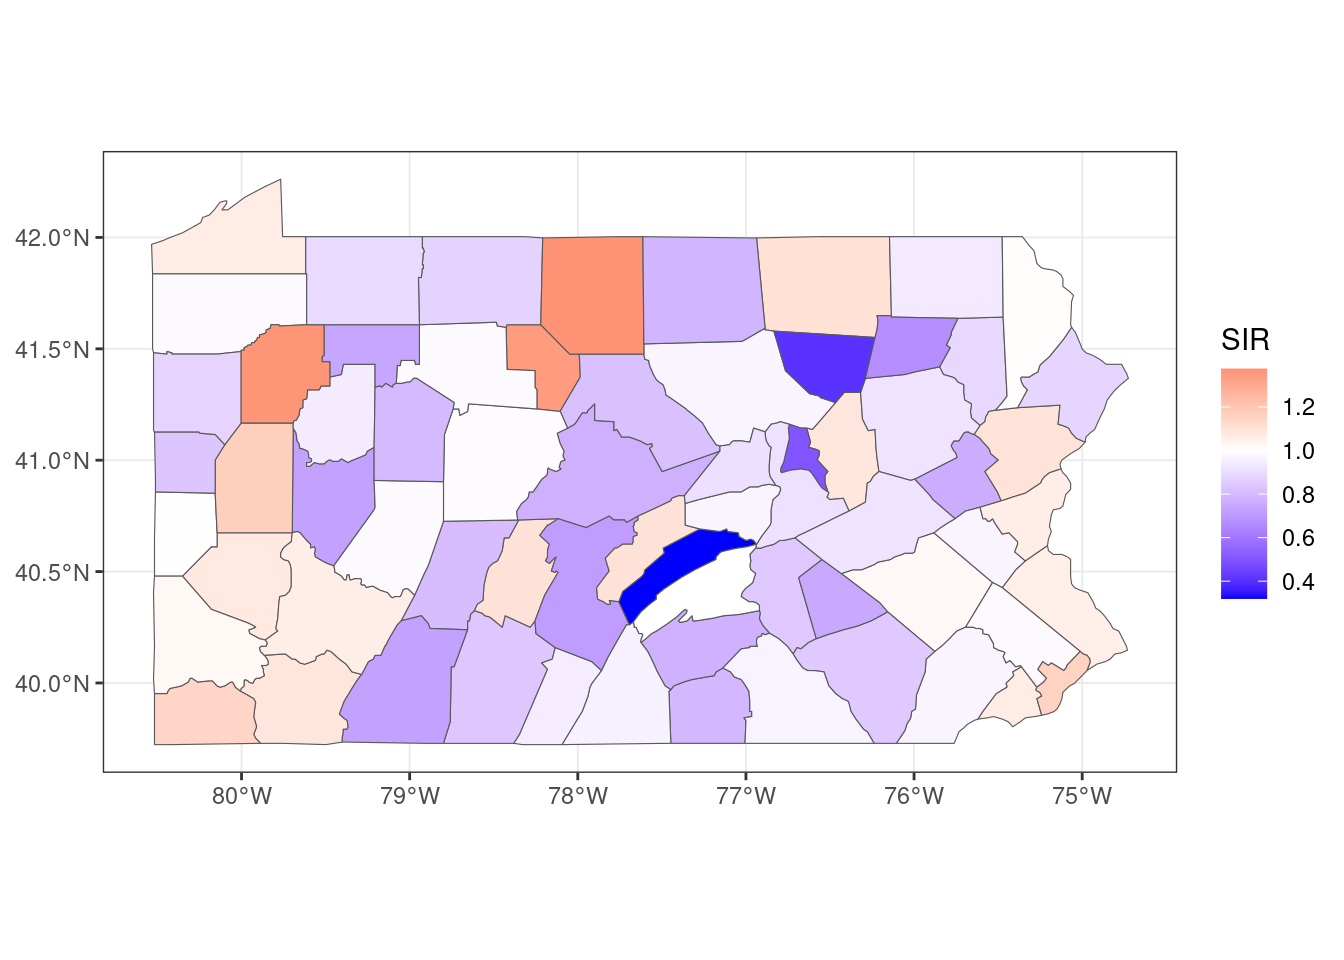
Figure 5.2: SIR of lung cancer in Pennsylvania counties