2.3 Shapefiles
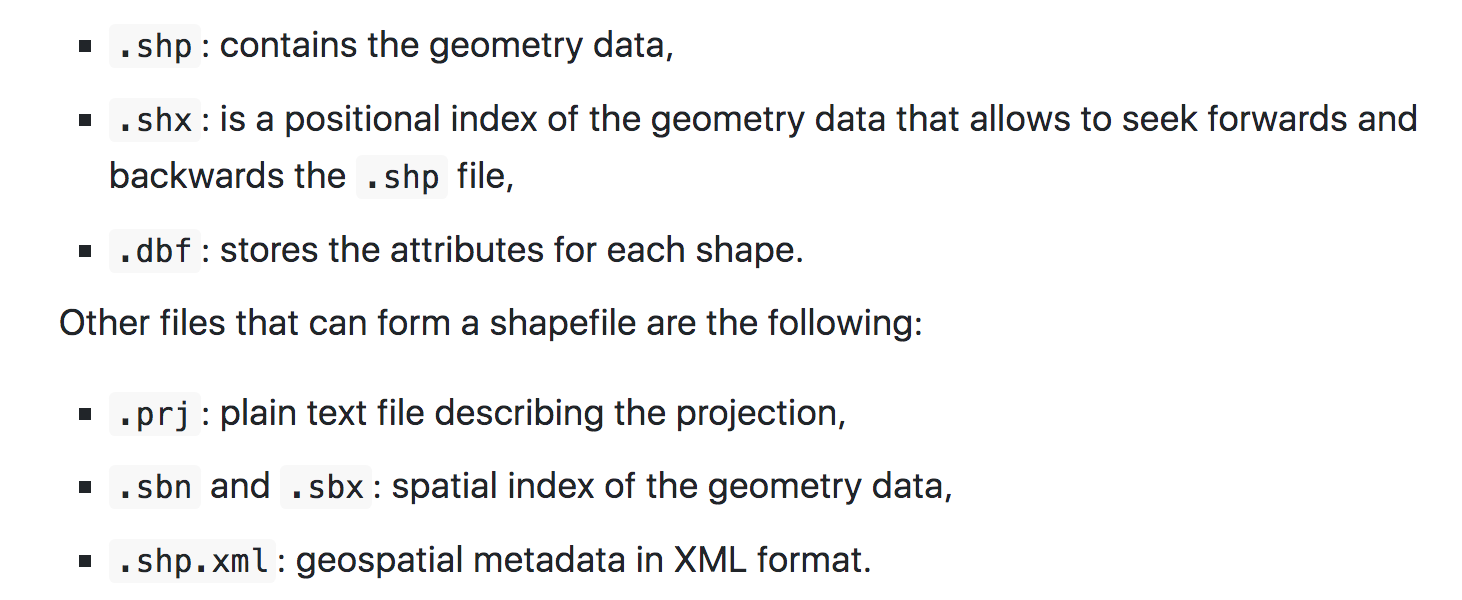
Consists of a collection of related files that have different extensions and a common name and are stored in the same directory.
A shapefile has three mandatory files with extensions .shp, .shx, and .dbf
knitr::include_graphics("images/02-shp.png")
# name of the shapefile of North Carolina of the sf package
nameshp <- system.file("shape/nc.shp", package = "sf")
# read shapefile with readOGR()

map <- rgdal::readOGR(nameshp, verbose = FALSE)
## Warning: OGR support is provided by the sf and terra packages among others## Warning: OGR support is provided by the sf and terra packages among others## Warning: OGR support is provided by the sf and terra packages among others## Warning: OGR support is provided by the sf and terra packages among others## Warning: OGR support is provided by the sf and terra packages among others## Warning: OGR support is provided by the sf and terra packages among others## Warning: OGR support is provided by the sf and terra packages among othersclass(map)## [1] "SpatialPolygonsDataFrame"
## attr(,"package")
## [1] "sp"map@bbox## min max
## x -84.32385 -75.45698
## y 33.88199 36.58965map@proj4string## Coordinate Reference System:
## Deprecated Proj.4 representation: +proj=longlat +datum=NAD27 +no_defs
## WKT2 2019 representation:
## GEOGCRS["NAD27",
## DATUM["North American Datum 1927",
## ELLIPSOID["Clarke 1866",6378206.4,294.978698213898,
## LENGTHUNIT["metre",1]]],
## PRIMEM["Greenwich",0,
## ANGLEUNIT["degree",0.0174532925199433]],
## CS[ellipsoidal,2],
## AXIS["latitude",north,
## ORDER[1],
## ANGLEUNIT["degree",0.0174532925199433]],
## AXIS["longitude",east,
## ORDER[2],
## ANGLEUNIT["degree",0.0174532925199433]],
## ID["EPSG",4267]]head(map@data)## AREA PERIMETER CNTY_ CNTY_ID NAME FIPS FIPSNO CRESS_ID BIR74 SID74
## 0 0.114 1.442 1825 1825 Ashe 37009 37009 5 1091 1
## 1 0.061 1.231 1827 1827 Alleghany 37005 37005 3 487 0
## 2 0.143 1.630 1828 1828 Surry 37171 37171 86 3188 5
## 3 0.070 2.968 1831 1831 Currituck 37053 37053 27 508 1
## 4 0.153 2.206 1832 1832 Northampton 37131 37131 66 1421 9
## 5 0.097 1.670 1833 1833 Hertford 37091 37091 46 1452 7
## NWBIR74 BIR79 SID79 NWBIR79
## 0 10 1364 0 19
## 1 10 542 3 12
## 2 208 3616 6 260
## 3 123 830 2 145
## 4 1066 1606 3 1197
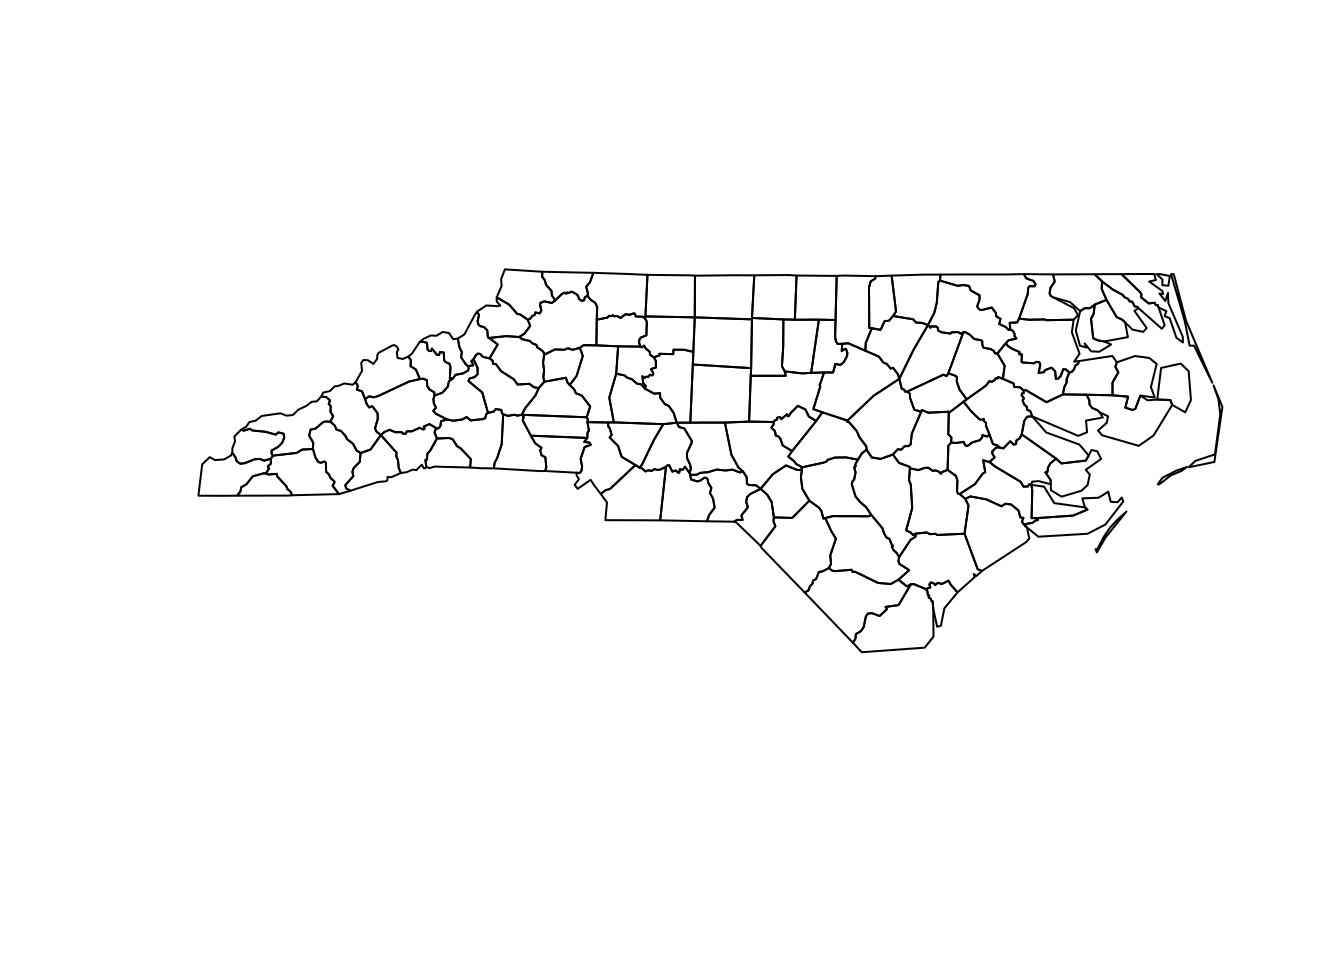
## 5 954 1838 5 1237plot(map)
# read shapefile with st_read()
map <- sf::st_read(nameshp, quiet = TRUE)

class(map)
## [1] "sf" "data.frame"head(map)## Simple feature collection with 6 features and 14 fields
## Geometry type: MULTIPOLYGON
## Dimension: XY
## Bounding box: xmin: -81.74107 ymin: 36.07282 xmax: -75.77316 ymax: 36.58965
## Geodetic CRS: NAD27
## AREA PERIMETER CNTY_ CNTY_ID NAME FIPS FIPSNO CRESS_ID BIR74 SID74
## 1 0.114 1.442 1825 1825 Ashe 37009 37009 5 1091 1
## 2 0.061 1.231 1827 1827 Alleghany 37005 37005 3 487 0
## 3 0.143 1.630 1828 1828 Surry 37171 37171 86 3188 5
## 4 0.070 2.968 1831 1831 Currituck 37053 37053 27 508 1
## 5 0.153 2.206 1832 1832 Northampton 37131 37131 66 1421 9
## 6 0.097 1.670 1833 1833 Hertford 37091 37091 46 1452 7
## NWBIR74 BIR79 SID79 NWBIR79 geometry
## 1 10 1364 0 19 MULTIPOLYGON (((-81.47276 3...
## 2 10 542 3 12 MULTIPOLYGON (((-81.23989 3...
## 3 208 3616 6 260 MULTIPOLYGON (((-80.45634 3...
## 4 123 830 2 145 MULTIPOLYGON (((-76.00897 3...
## 5 1066 1606 3 1197 MULTIPOLYGON (((-77.21767 3...
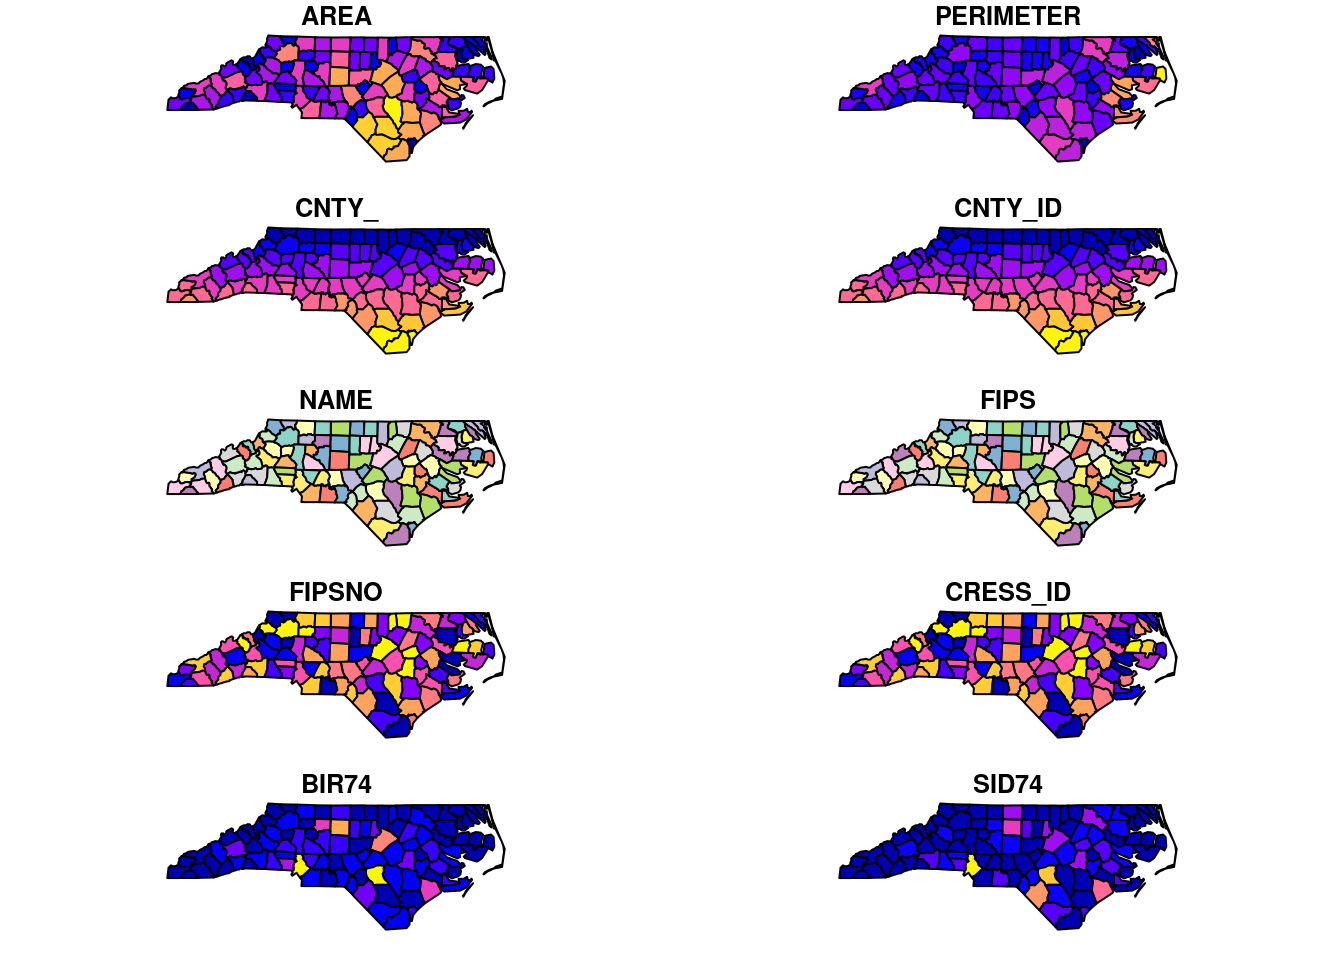
## 6 954 1838 5 1237 MULTIPOLYGON (((-76.74506 3...plot(map)## Warning: plotting the first 10 out of 14 attributes; use max.plot = 14 to plot
## all