Distribution
- A variable’s distribution is a description of how often different values occur.
- Categorical/ordinal:
- table with percentages AKA frequency table/bar chart
- Continuous:
- histogram (like bar chart): It’s the exact same thing as the frequency table or graph we used for the categorical variable, except that the categories are ranges of the variable rather than the full list of values it could take.
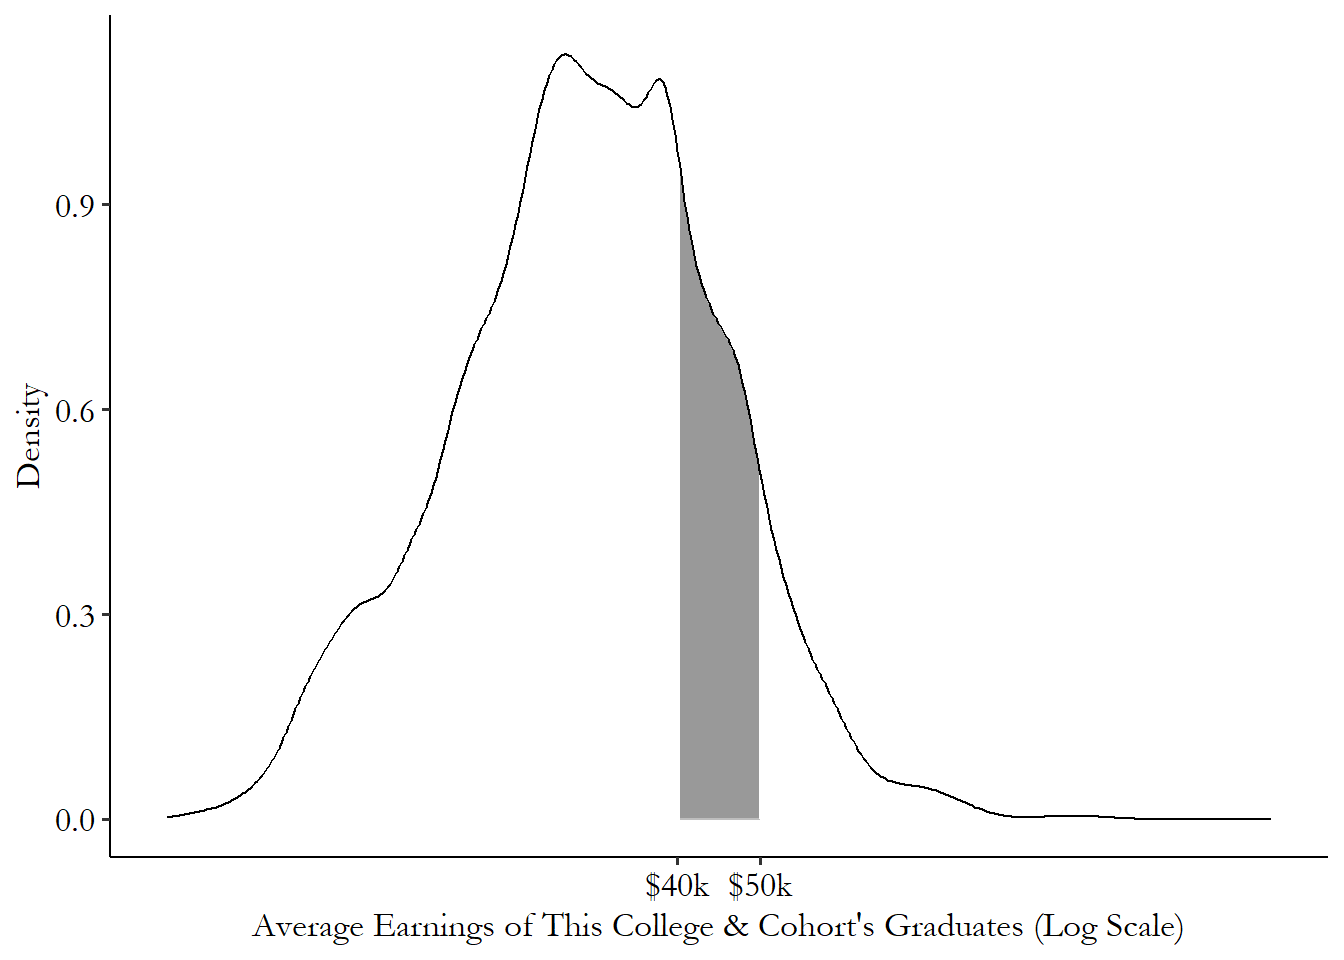
- Density plot: like drawing infinitely small ranges for a histogram. we can describe the probability of being in a given range of the variable by seeing how large the area underneath the distribution is.