7.5 Plotting based on attributes
V(moneyNetwork_ig)$color <- ifelse(V(moneyNetwork_ig)$Gender == "Male", "dodgerblue3","seagreen")plot(moneyNetwork_ig,
layout = kk_layout,
vertex.size = 10,
vertex.frame.color = "black",
vertex.label.cex = .7,
vertex.label = NA,
edge.curved = .1,
edge.arrow.size = .3)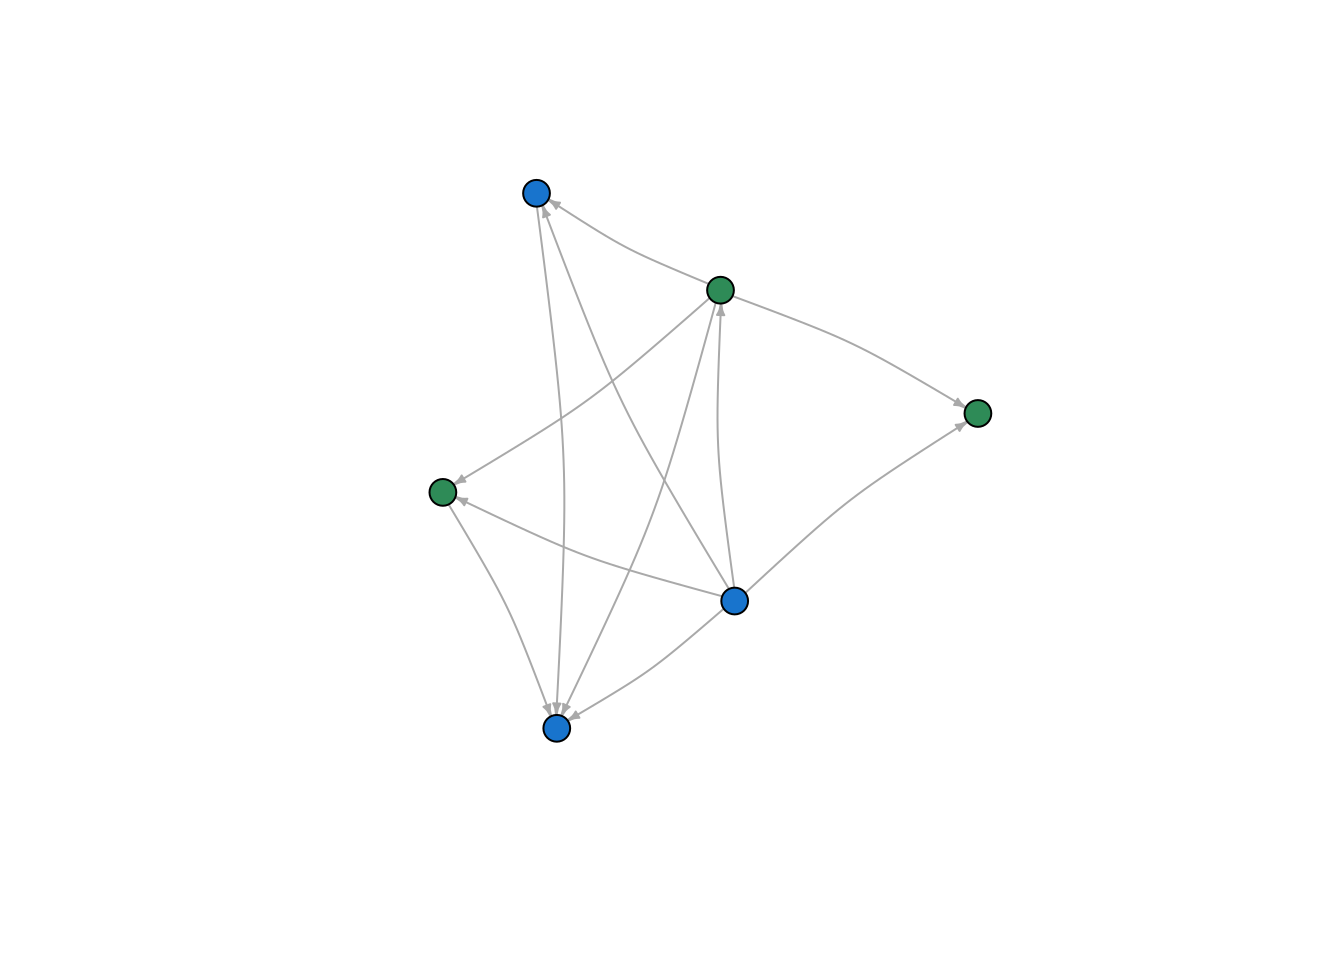
ggraph(moneyNetwork_tg, layout = kk_layout) + #kamada.kawai
  geom_edge_fan(width = 1,
                aes(alpha = after_stat(index)),
                show.legend = FALSE) +
  geom_node_point(aes(color = Gender), size = 5)+
  scale_color_manual(values = c(Female = "seagreen", Male = "dodgerblue3"))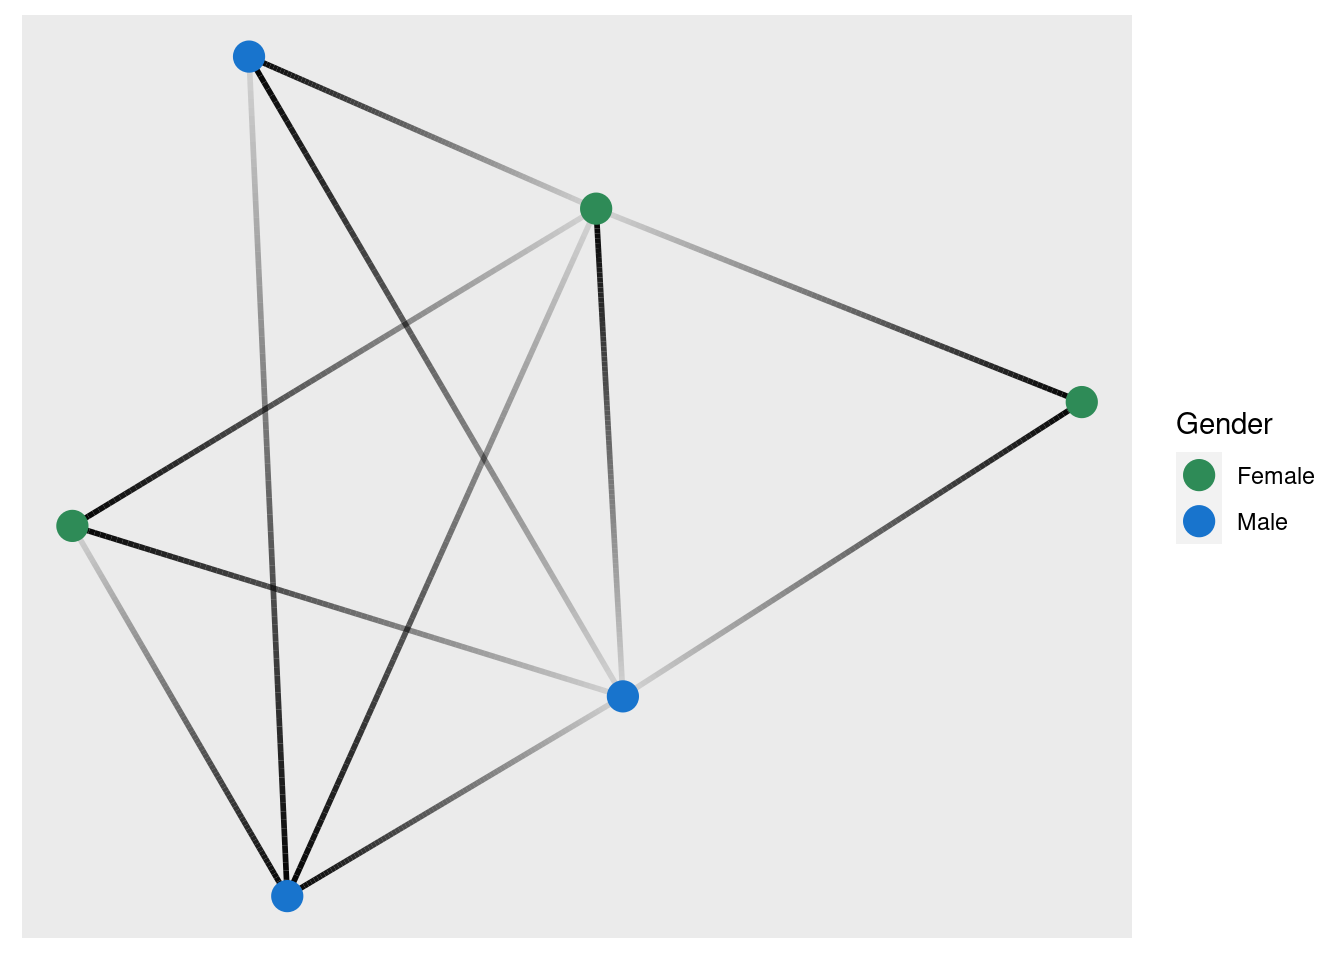
Now let’s try role. First, I reset color. There are four roles (Father, Mother, Son, Daughter), so we need a few more ifelse statements to code for all of them.
V(moneyNetwork_ig)$color <- NA
role_ig <- V(moneyNetwork_ig)$Role
V(moneyNetwork_ig)$color <- case_when(
 role_ig == "Father" ~ "burlywood1",
  role_ig == "Mother" ~ "seagreen",
  role_ig == "Son" ~ "grey70",
  TRUE ~ "tomato")

plot(moneyNetwork_ig,
     layout = kk_layout,
     vertex.size = 10,
     vertex.label.cex = .7,
     vertex.label = NA,
     edge.curved = .1,
     vertex.frame.color = "black",
     edge.arrow.size = .3,
     edge.width = .7,
     edge.color = "grey30")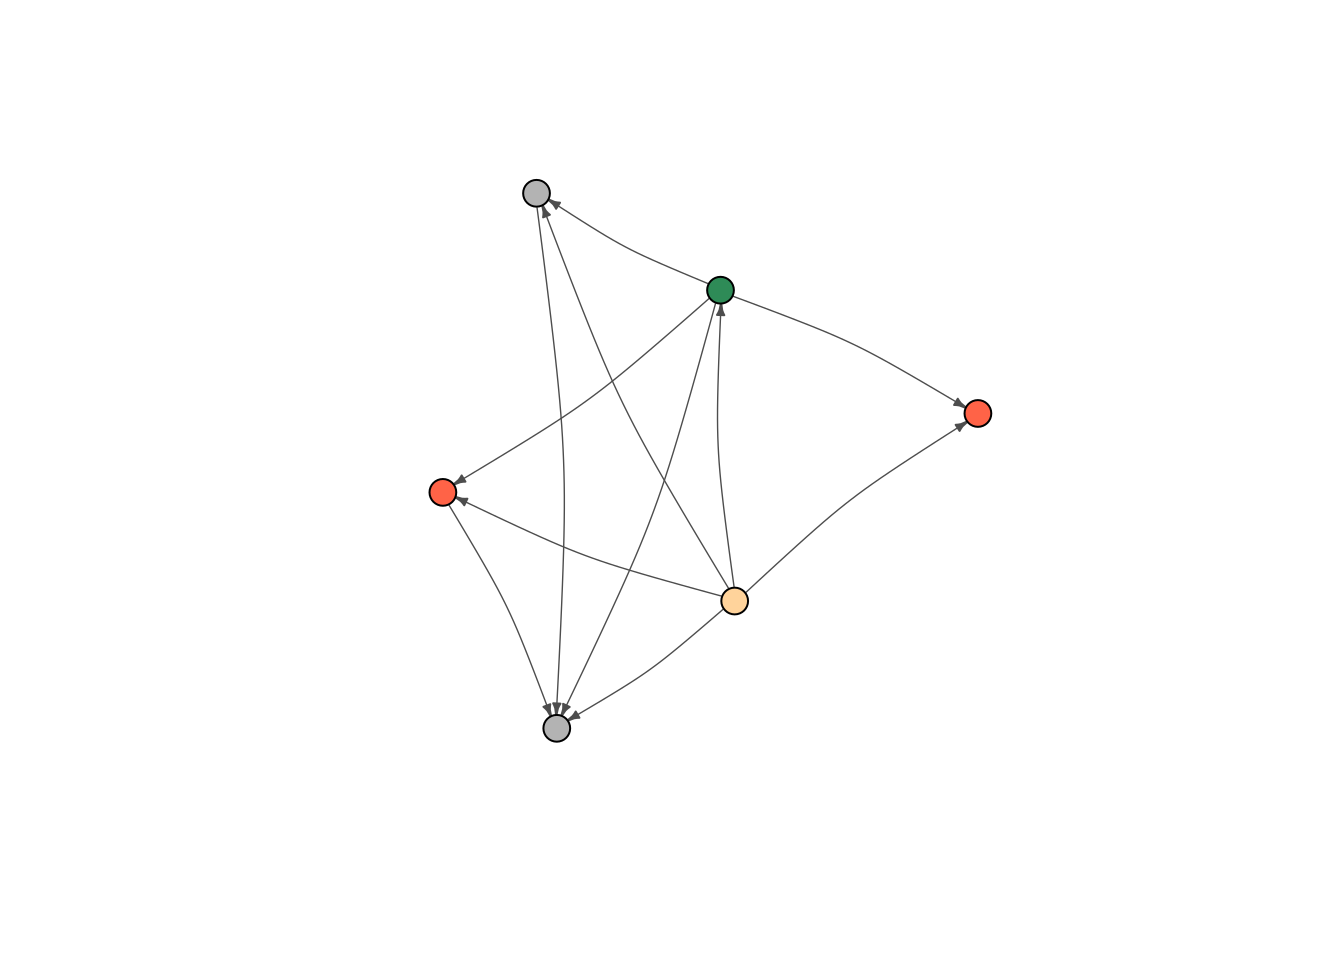
ggraph(moneyNetwork_tg, layout = kk_layout) + #kamada.kawai
  geom_edge_fan(width = 1,
                aes(alpha = after_stat(index)),
                show.legend = FALSE) +
  geom_node_point(aes(color = Role), size = 5)+
  scale_color_manual(values = c(Father = "burlywood1",
                                Mother = "seagreen",
                                Son = "grey70",
                                Daughter = "tomato"))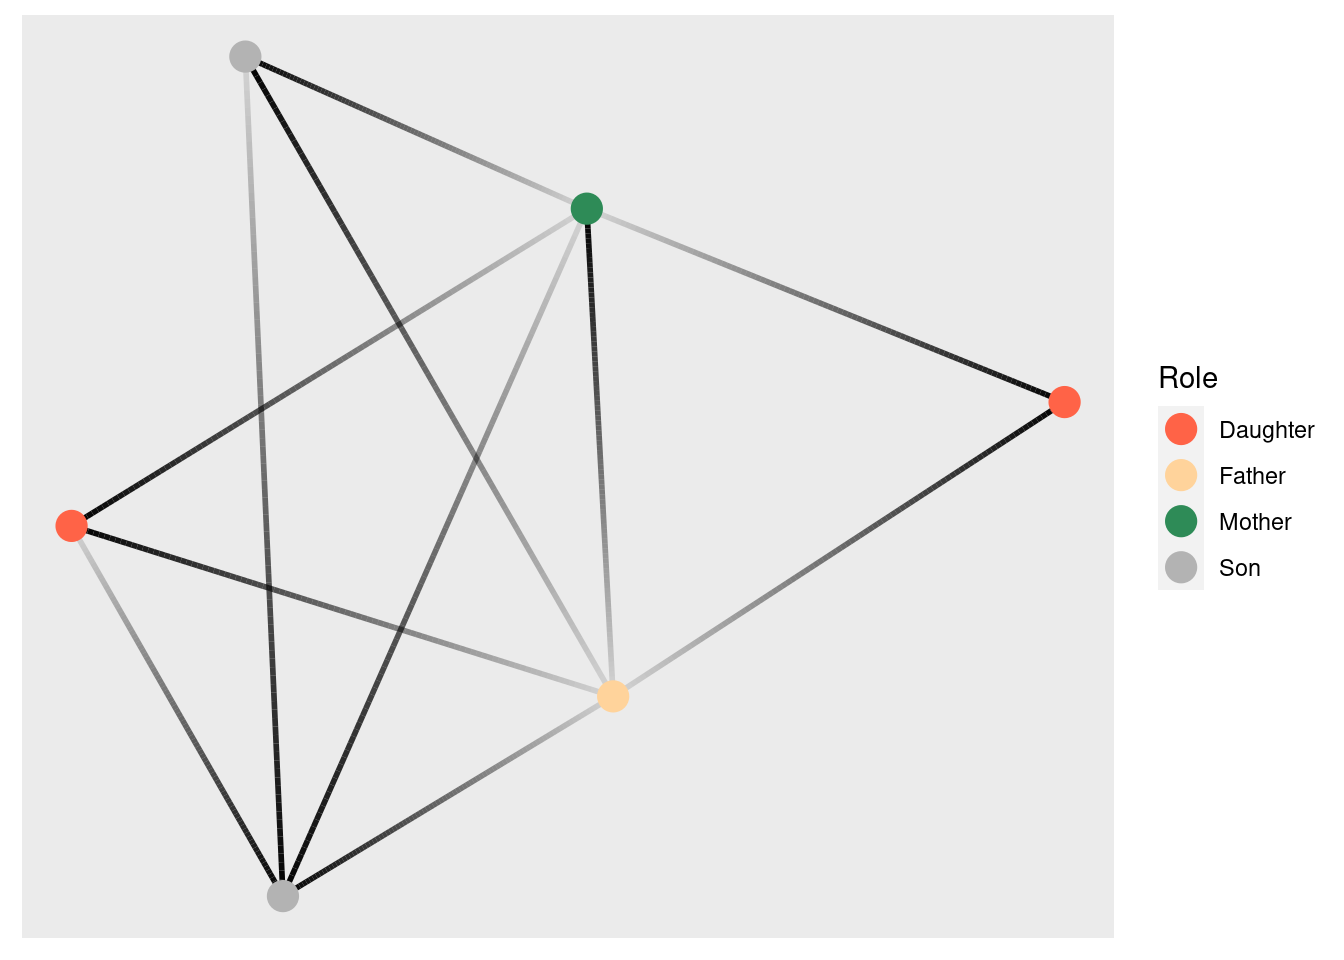
Last but not least, let’s adjust the sizes of the nodes so that they reflect differences in age. We can set node size to be 1/5th of the node’s age with the code below. Simple, but effective. It looks like the oldest nodes give to the most people.
V(moneyNetwork_ig)$size = V(moneyNetwork_ig)$Age/5

plot(moneyNetwork_ig,
     layout = kk_layout,
     vertex.label.cex = .7,
     vertex.label = NA,
     edge.curved = .1,
     vertex.frame.color = "black",
     edge.arrow.size = .3,
     edge.width = .7,
     edge.color = "grey30")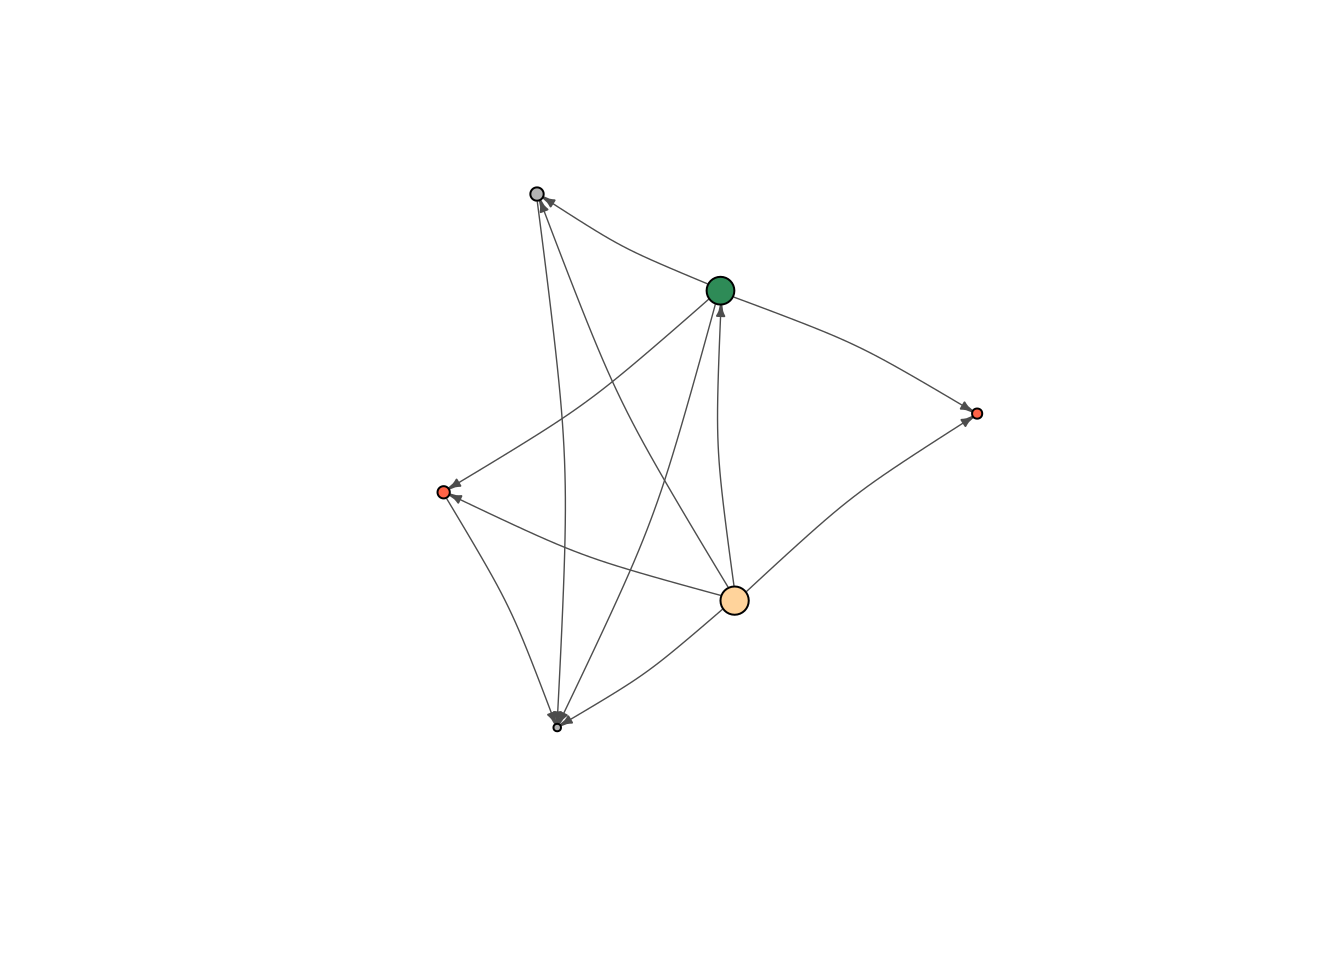
ggraph(moneyNetwork_tg, layout = kk_layout) + #kamada.kawai
geom_edge_fan(width = 1,
aes(alpha = after_stat(index)),
show.legend = FALSE) +
geom_node_point(aes(color = Role,
size = Age/5))+
scale_color_manual(values = c(Father = "burlywood1",
Mother = "seagreen",
Son = "grey70",
Daughter = "tomato"))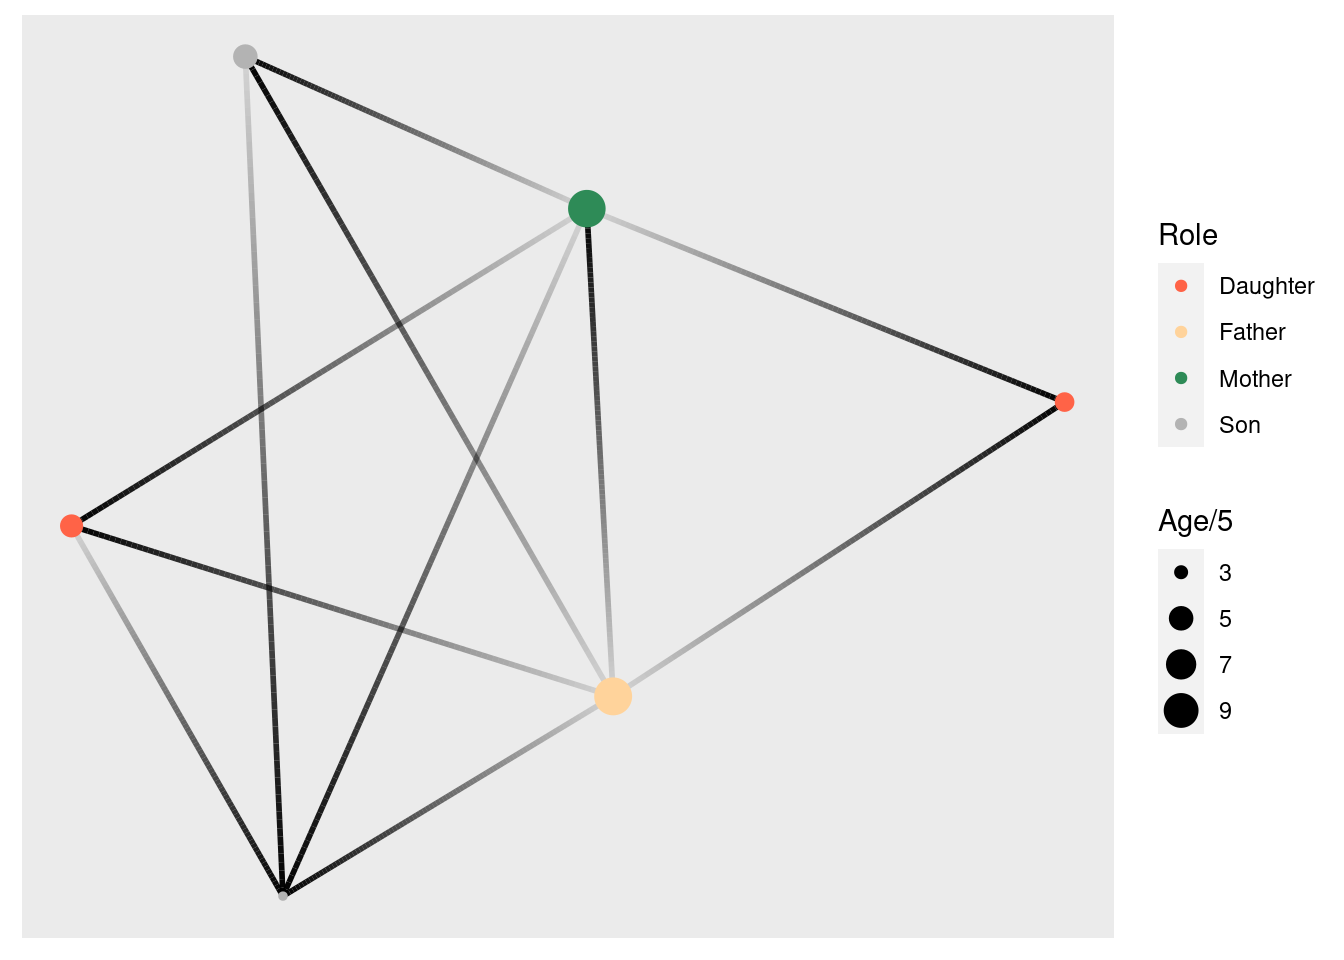 ## Meeting Videos