7.3 Layouts
– A network’s layout determines the nodes’ positions in the plot. – All layouts try to minimize the number of edges that cross.
The author states that he usually uses either the Kamada Kawai (igraph::layout.kamada.kawai(); ggraph:::layout_tbl_graph_igraph()) algorithm or the Fruchterman Reingold algorithm.
Kamada Kawai
# first we run the layout function on our graph
kamadaLayout <- layout.kamada.kawai(moneyNetwork_ig)

# and then we change the default layout setting to equal the layout we generated above
plot(moneyNetwork_ig,
     layout = kamadaLayout,
     vertex.size = 10,
     vertex.color = "tomato",
     vertex.frame.color = NA,
     vertex.label.cex = .7,
     vertex.label = NA,
     edge.curved = .1,
     edge.arrow.size = .3,
     edge.width = .7)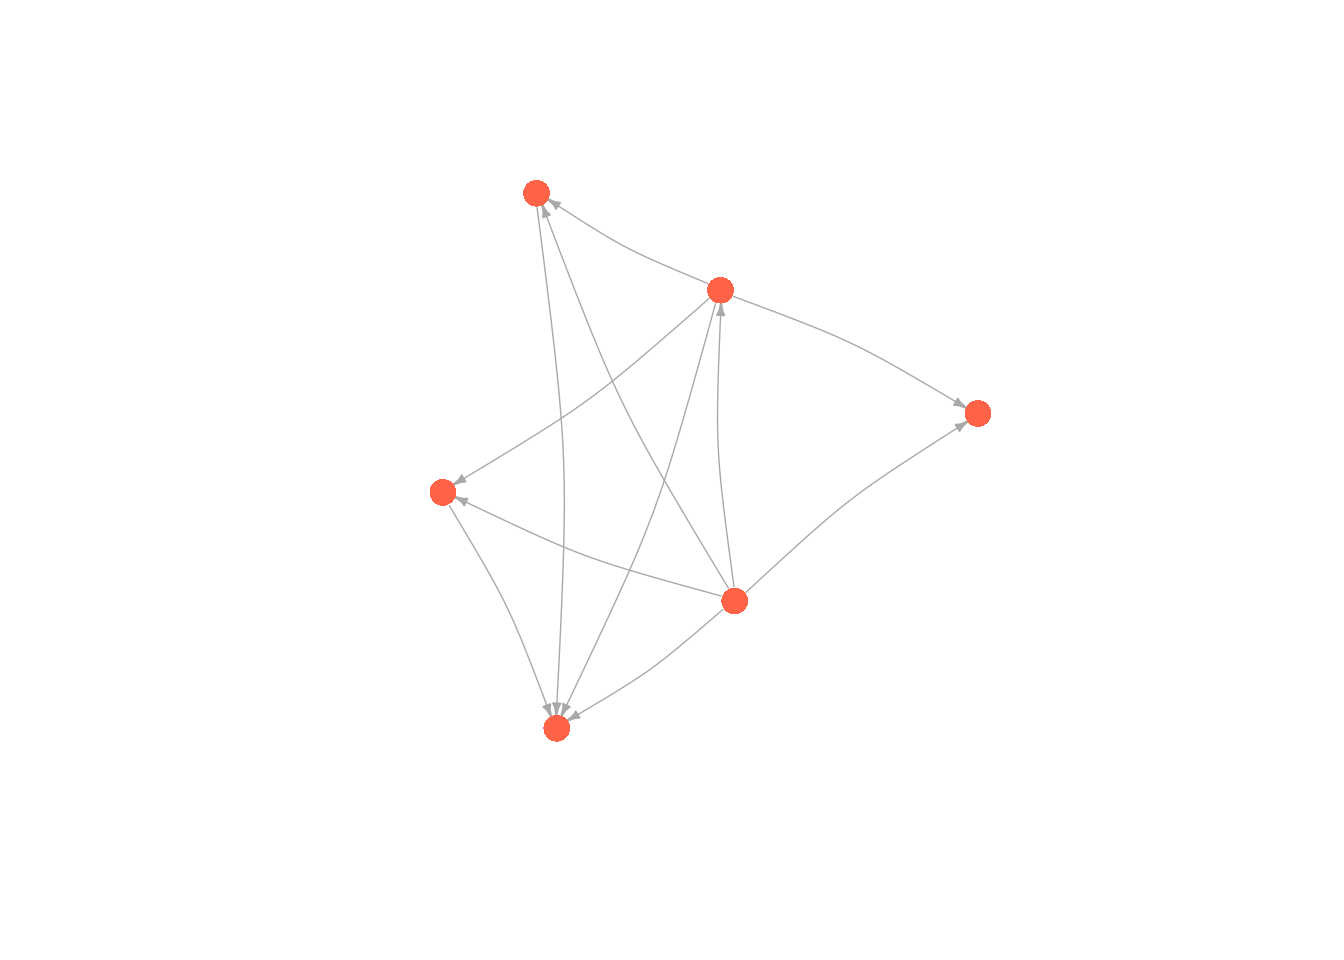
ggraph(moneyNetwork_tg, layout = kamadaLayout) +
  geom_edge_fan(width = 1,
                aes(alpha = after_stat(index)),
                show.legend = FALSE) +
  geom_node_point(color = "tomato", size = 5)+
  geom_node_text(aes(label = name))
The layout can be directly stated in ggraph call
ggraph(moneyNetwork_tg, layout = "kk") + #kamada.kawai
  geom_edge_fan(width = 1,
                aes(alpha = after_stat(index)),
                show.legend = FALSE) +
  geom_node_point(color = "tomato", size = 5)+
  geom_node_text(aes(label = name))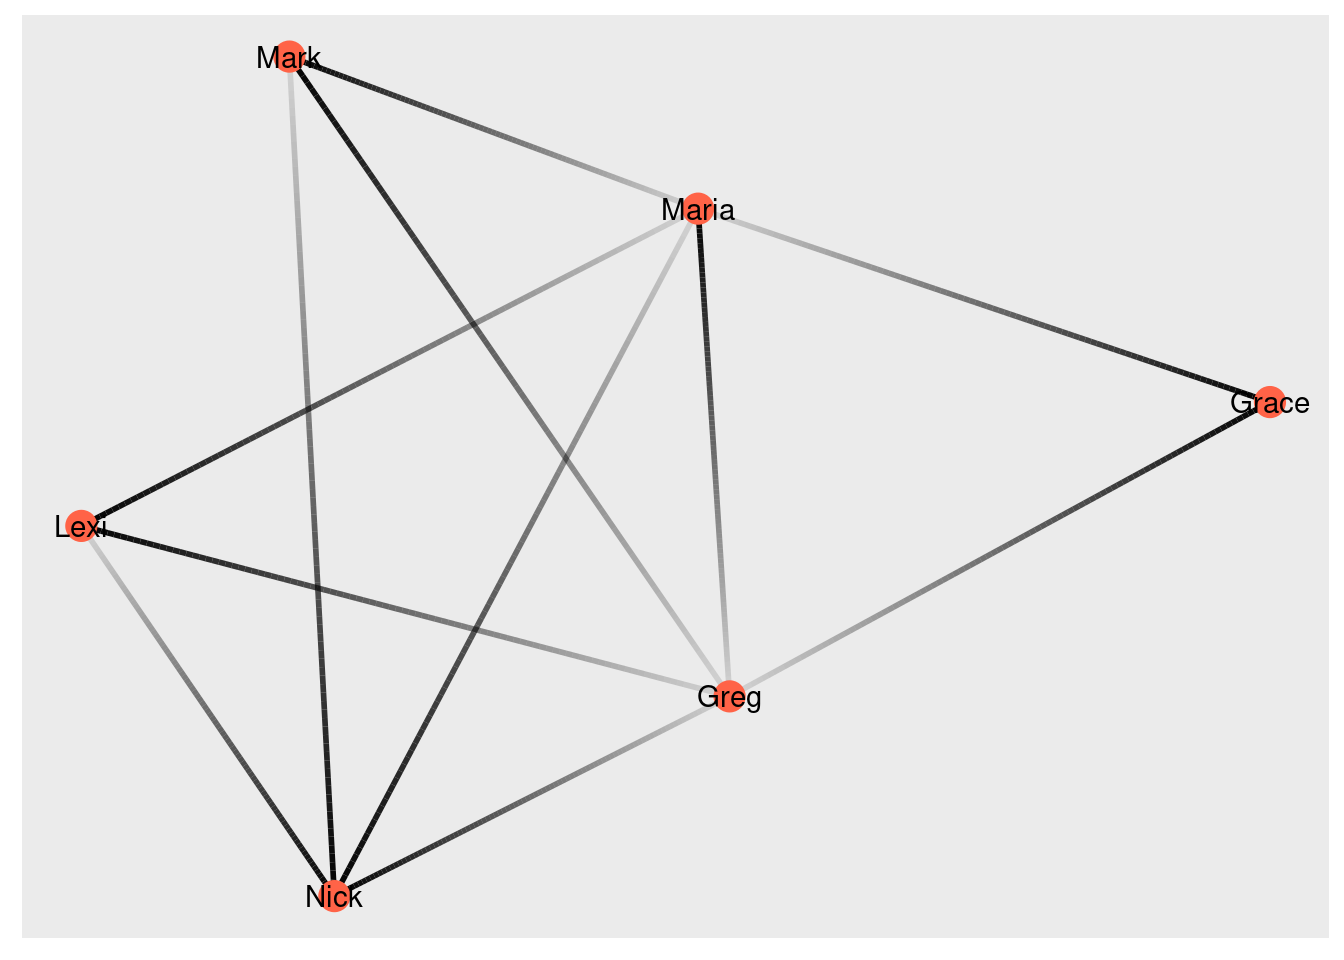
Check for layouts available ggraph from igraph ?ggraph:::layout_tbl_graph_igraph()