10.1 Indirect connections
Linking individuals indirectly based on shared features.
Example: Affiliation data.
name <- c("Leo", "Clement", "Palla", "Filippo")
class1 <- c("Biostatistics","Islamic Civ", "Calc 1", "Linear Algebra")
class2 <- c("Chemistry", "The Modern World-System", "Calc 2", "Social Networks")
class3 <- c("Linear Algebra", "Exile and Diaspora", "Linear Algebra", "The Modern World-System")
(classes_data <- bind_cols(name = name,
                           class1 = class1,
                           class2 = class2,
                           class3 = class3))
## # A tibble: 4 × 4
## name class1 class2 class3
## <chr> <chr> <chr> <chr>
## 1 Leo Biostatistics Chemistry Linear Algebra
## 2 Clement Islamic Civ The Modern World-System Exile and Diaspora
## 3 Palla Calc 1 Calc 2 Linear Algebra
## 4 Filippo Linear Algebra Social Networks The Modern World-SystemGet edgelist by converting from wide to long format
(classes_data <- classes_data %>%
  pivot_longer(-name,
               names_to = NULL, #discard colum names
               values_to = "classes"))
## # A tibble: 12 × 2
## name classes
## <chr> <chr>
## 1 Leo Biostatistics
## 2 Leo Chemistry
## 3 Leo Linear Algebra
## 4 Clement Islamic Civ
## 5 Clement The Modern World-System
## 6 Clement Exile and Diaspora
## 7 Palla Calc 1
## 8 Palla Calc 2
## 9 Palla Linear Algebra
## 10 Filippo Linear Algebra
## 11 Filippo Social Networks
## 12 Filippo The Modern World-SystemConvert edgelist into an incidence matrix.
(classesMatrix <- classes_data %>%
  sjmisc::flat_table() %>%
  as.matrix())
## classes
## name Biostatistics Calc 1 Calc 2 Chemistry Exile and Diaspora Islamic Civ
## Clement 0 0 0 0 1 1
## Filippo 0 0 0 0 0 0
## Leo 1 0 0 1 0 0
## Palla 0 1 1 0 0 0
## classes
## name Linear Algebra Social Networks The Modern World-System
## Clement 0 0 1
## Filippo 1 1 1
## Leo 1 0 0
## Palla 1 0 0In an incidence matrix, the rows are of one class of node, while columns are of another. The rows are generally people who are affiliated with groups in the columns.
Using the get.incidence() function will turn our matrix into a bipartite network.
(classesNet_tg <- graph.incidence(classesMatrix,
                                 mode = c("all")#all mutual edges
                                 ) %>%
  as_tbl_graph())
## # A tbl_graph: 13 nodes and 12 edges
## #
## # An unrooted tree
## #
## # A tibble: 13 × 2
## type name
## <lgl> <chr>
## 1 FALSE Clement
## 2 FALSE Filippo
## 3 FALSE Leo
## 4 FALSE Palla
## 5 TRUE Biostatistics
## 6 TRUE Calc 1
## # ℹ 7 more rows
## #
## # A tibble: 12 × 2
## from to
## <int> <int>
## 1 1 9
## 2 1 10
## 3 1 13
## # ℹ 9 more rows(classesNet_tg <- classesNet_tg %>%
mutate(type = ifelse(type, "Affiliations", "Individuals")))## # A tbl_graph: 13 nodes and 12 edges
## #
## # An unrooted tree
## #
## # A tibble: 13 × 2
## type name
## <chr> <chr>
## 1 Individuals Clement
## 2 Individuals Filippo
## 3 Individuals Leo
## 4 Individuals Palla
## 5 Affiliations Biostatistics
## 6 Affiliations Calc 1
## # ℹ 7 more rows
## #
## # A tibble: 12 × 2
## from to
## <int> <int>
## 1 1 9
## 2 1 10
## 3 1 13
## # ℹ 9 more rowsggraph(classesNet_tg, layout = 'kk') +
geom_edge_link() +
geom_node_label(aes(label = name, fill = type))+
guides(fill = guide_legend(
override.aes = aes(size = 5,
label = "")
))+
theme(legend.position = c(0.1,0.1),
legend.text = element_text(size = 10))## Warning: Using the `size` aesthetic in this geom was deprecated in ggplot2 3.4.0.
## ℹ Please use `linewidth` in the `default_aes` field and elsewhere instead.
## This warning is displayed once every 8 hours.
## Call `lifecycle::last_lifecycle_warnings()` to see where this warning was
## generated.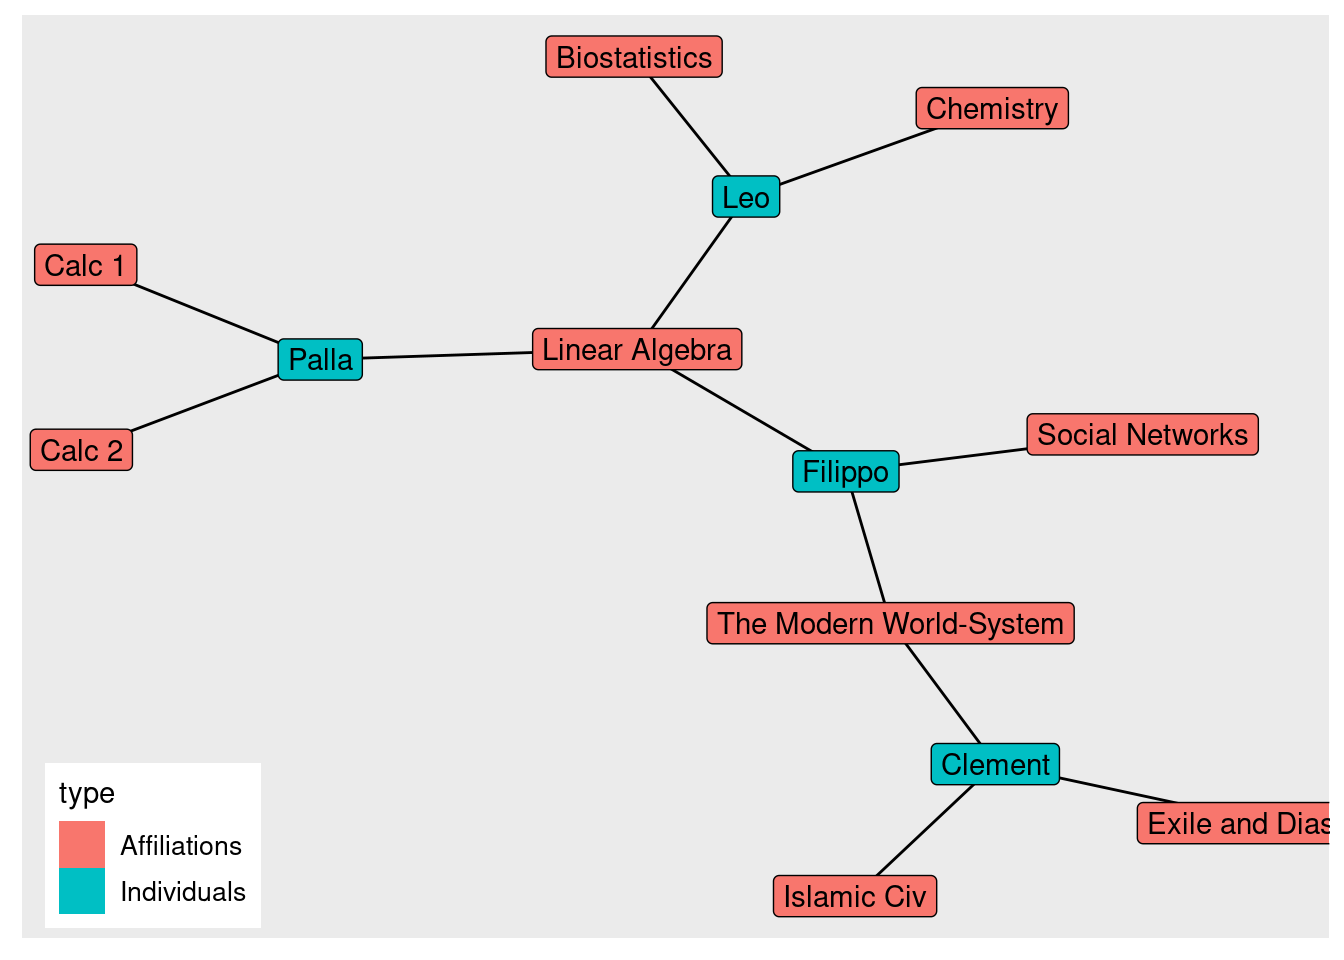
10.1.1 Unipartite Projection
Using igraph bipartite.projection
graph.incidence(classesMatrix,
                mode = c("all")#all mutual edges
                ) %>%
  bipartite.projection(which = "false") #select the projection of interest. Here it's students
## IGRAPH 30d9bf4 UNW- 4 4 --
## + attr: name (v/c), weight (e/n)
## + edges from 30d9bf4 (vertex names):
## [1] Clement--Filippo Filippo--Leo Filippo--Palla Leo --PallaThe mathematical operation to make a person-to-person projection is to multiply the initial matrix by its transpose. In R that looks like:
personMatrix <- classesMatrix %*% t(classesMatrix)The diagonal of this new matrix tells us the number of groups each person is affiliated with, but we set it to 0 using the ?diag function.
number_of_classes_taken = diag(personMatrix)
diag(personMatrix) <- 0
personMatrix %>%
graph.adjacency() %>%
as_tbl_graph() %>%
ggraph( layout = 'kk') +
geom_edge_link() +
geom_node_label(aes(label = name))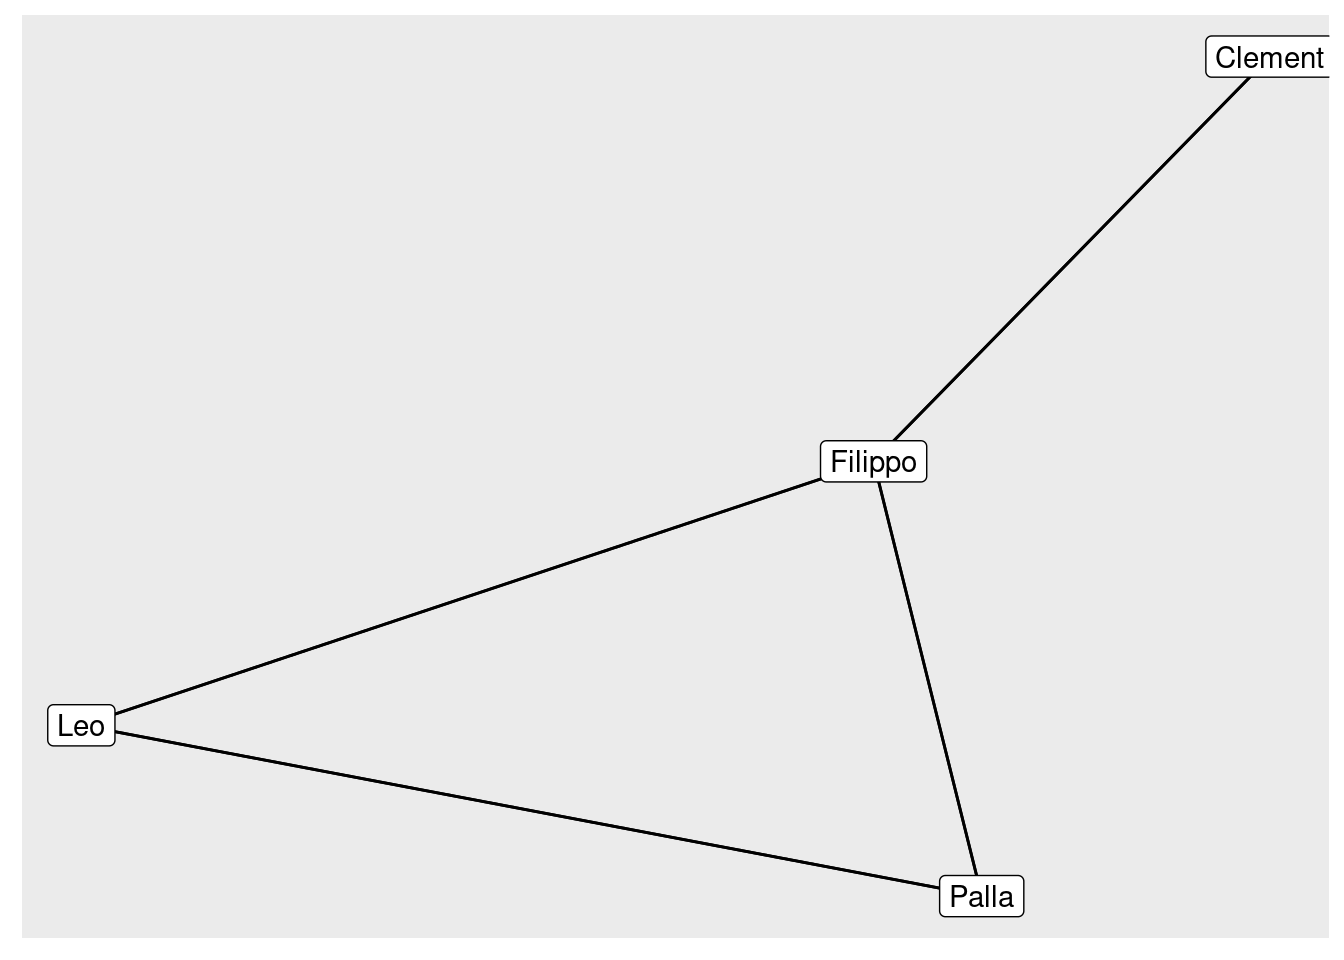
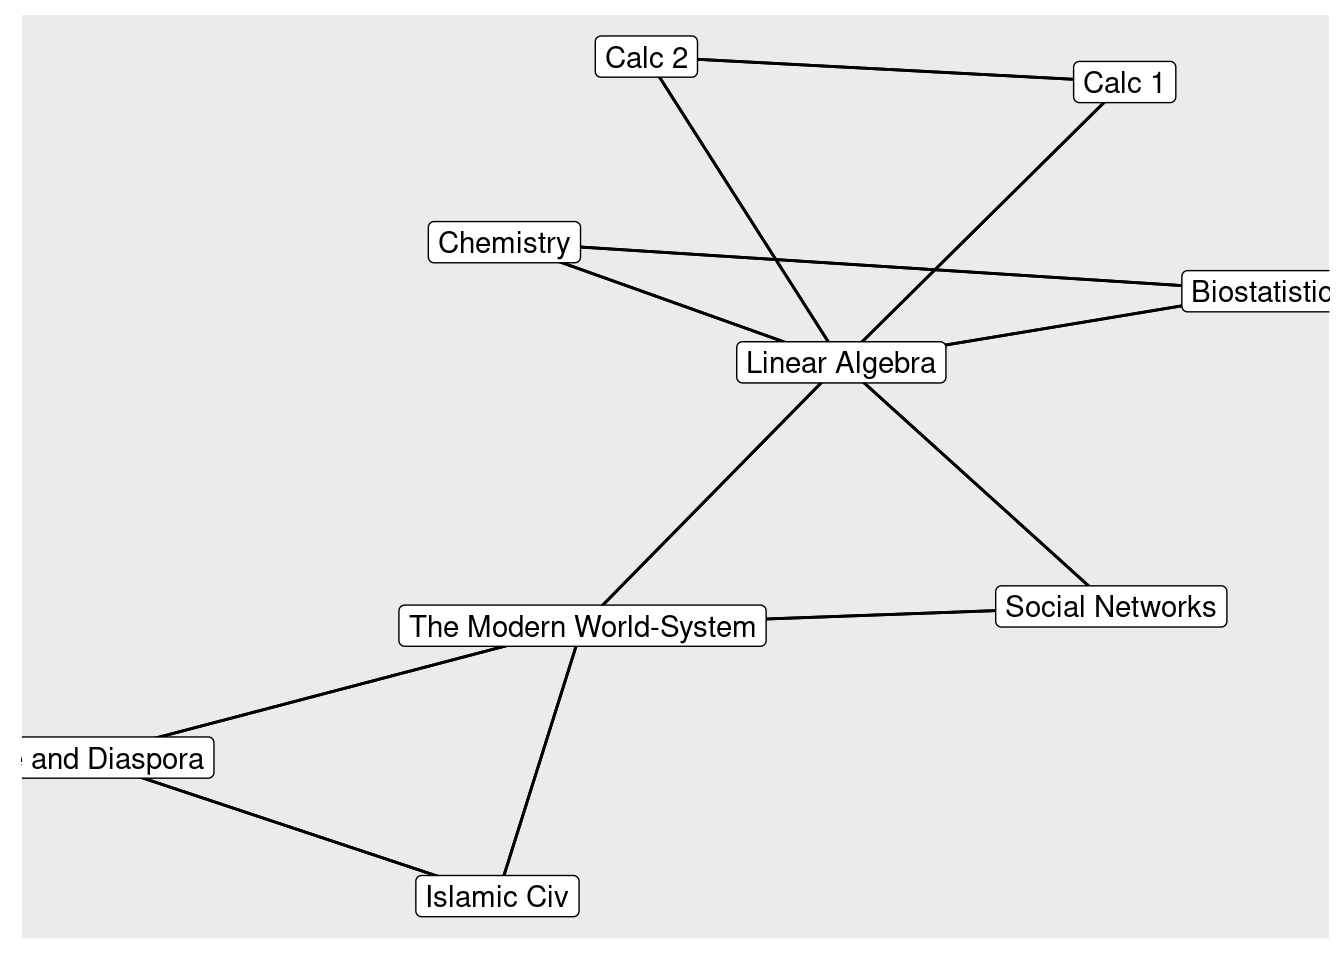
To get the group-to-group matrix, we multiply the transpose by the initial ma
trix (reverse!)
groupMatrix = t(classesMatrix) %*% classesMatrix
number_of_students <- diag(groupMatrix)
diag(groupMatrix) <- 0 # we again set it to 0
groupMatrix %>%
graph.adjacency() %>%
as_tbl_graph() %>%
ggraph( layout = 'kk') +
geom_edge_link() +
geom_node_label(aes(label = name))