st_coordinates()
sf
inla()
With nb.plot(<neighbours list>, <sfc object>)
nb.plot(<neighbours list>, <sfc object>)
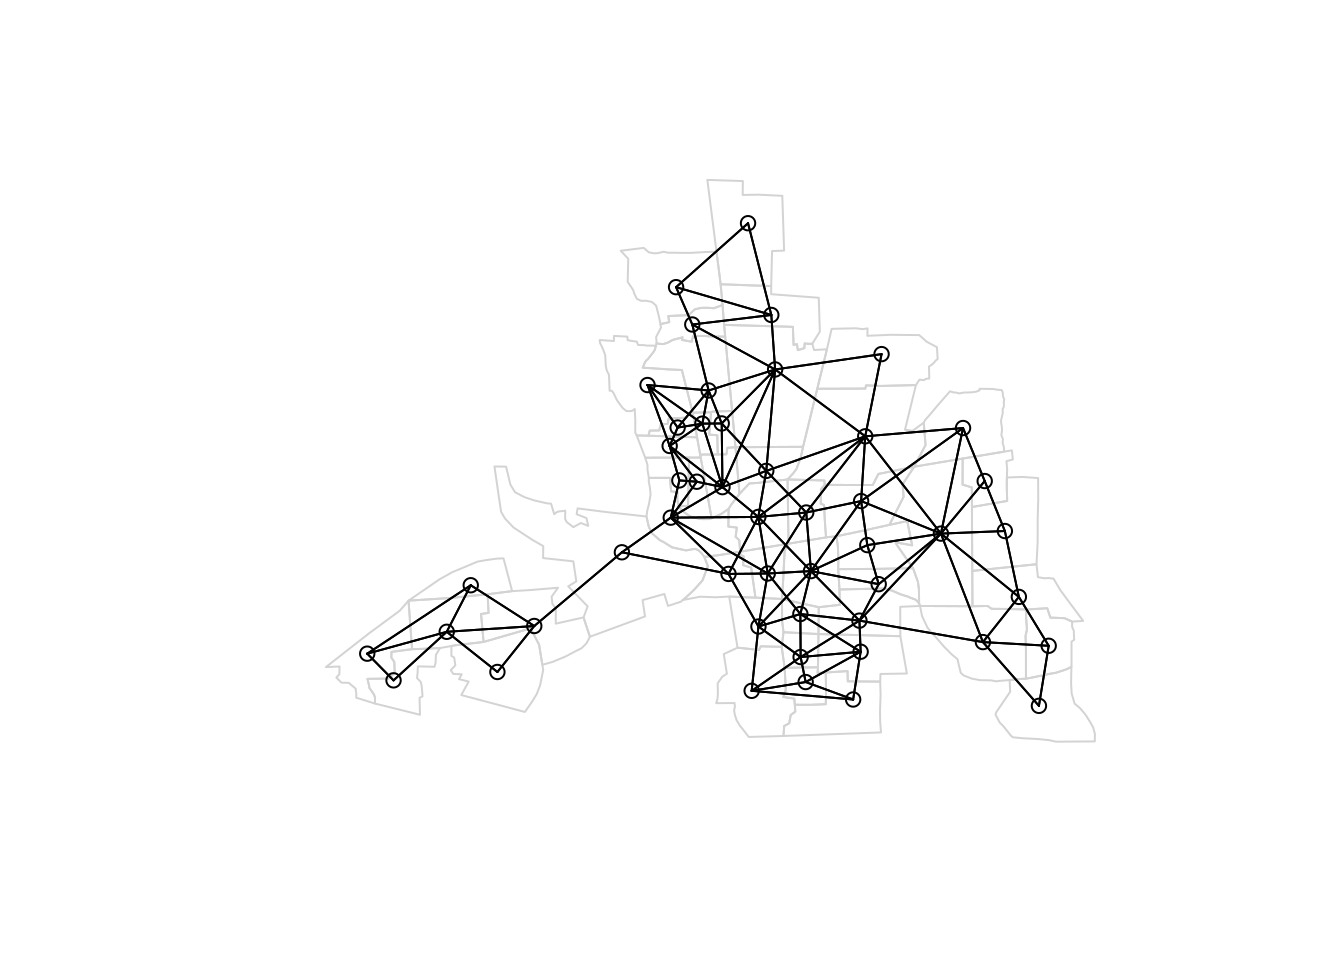
plot(map_geom, border = "lightgray")
plot.nb(nb1, map_geom, add = TRUE)