Spatial Statistics for Data Science: Theory and Practice with R Book Club
Welcome
Book club meetings
Pace
1
Types of spatial data
SLIDE 1
Meeting Videos
Cohort 1
2
Spatial data in R
SLIDE 1
Meeting Videos
Cohort 1
3
The sf package for spatial vector data
Simple features (1)
Simple features (2)
Simple features in R (1)
Simple features in R (2)
Simple features in R (3)
Simple features in R (4)
Simple features in R (5)
Simple features in R (6)
Simple features in R (7)
Simple features in R (8)
Simple features in R (9)
Simple features in R (10)
Static maps with ggplot2 (1)
Static maps with ggplot2 (2)
Interactive maps with mapview (1)
Interactive maps with mapview (2)
Another
st_coordinates()
example
Writing an sf object to file
Subsetting simple features (1)
Subsetting simple features (2)
Subsetting simple features (3)
Subsetting simple features (4)
Subsetting simple features (5)
Subsetting simple features (6)
Subsetting simple features (7)
Generate sf objects (1)
Generate sf objects (2)
Generate sf objects (3)
Generate sf objects (4)
Generate sf objects (5)
Generate sf objects (6)
Generate sf objects (7)
Generate sf objects (8)
Generate sf objects (9)
Generate sf objects (10)
Manipulating sf objects (1)
Manipulating sf objects (2)
Manipulating sf objects (3)
Manipulating sf objects (5)
Manipulating sf objects (4)
Manipulating sf objects (6)
Manipulating sf objects (7)
Binary logical operations (1)
Binary logical operations (2)
Binary logical operations (3)
Binary logical operations (4)
Binary logical operations (5)
Binary logical operations (6)
Binary logical operations (7)
Binary logical operations (8)
Binary logical operations (9)
Binary logical operations (10)
Binary logical operations (11)
Joining
sf
object with data (1)
Joining
sf
object with data (2)
Joining
sf
object with data (3)
Joining
sf
object with data (4)
Meeting Videos
Cohort 1
4
The terra package for raster and vector data
SLIDE 1
Meeting Videos
Cohort 1
5
Making maps with R
SLIDE 1
Meeting Videos
Cohort 1
6
R packages to download open spatial data
6.1
Packages
6.1.1
Example with rnaturalearth
6.2
geodata
6.3
chirps
6.4
elevatr
6.5
osmdata
6.5.1
with leaflet
6.6
wbstats
6.6.1
with mapview
6.7
spocc
Meeting Videos
Cohort 1
7
Spatial neighbourhood matrices
Areal data
Spatial neighbourhood
Spatial neighbourhood
Spatial neighbourhood in R
Read example data
Example data
Example data
Spatial neighbourhood
Spatial neighbours
Spatial neighbours list
Defining who is a neighbour and who isn’t
Creating a neighbours list (‘nb’) from geometries
Neighbours list: type Queen contiguity
Neighbours list: type Rook contiguity
Plotting
Plotting
Neighbours list based on distance bounds
Neighbours list based on distance bounds
Neighbours list based on distance bounds
Neighbours list based on distance bounds
Neighbours list based on
\(k\)
nearest neighbours
Neighbours list based on
\(k\)
nearest neighbours
Neighbours list based on
\(k\)
nearest neighbours
Creating higher order neighbours lists
Creating higher order neighbours lists
Creating higher order neighbours lists
Creating higher order neighbours lists
Creating higher order neighbours lists
Creating higher order neighbours lists
Cumulating neighbours lists
Cumulating neighbours lists
Further things to do with a neighbours list
Count neighbours
Compute distances between neighbours
Compute distances between neighbours
Neighbourhood matrix
Neighbourhood matrix
Neighbourhood matrix
Neighbourhood matrix
Neighbourhood matrix
Neighbourhood matrix
Neighbourhood matrix
Neighbourhood matrix
Meeting Videos
Cohort 1
8
Spatial autocorrelation
SLIDE 1
Meeting Videos
Cohort 1
9
Bayesian spatial models
Bayesian spatial models in INLA
Bayesian spatial models in INLA
Bayesian spatial models in INLA
Bayesian spatial models in INLA
Bayesian spatial models in INLA
Bayesian spatial models in INLA
Bayesian spatial models in INLA
Bayesian spatial models in INLA
Bayesian spatial models in INLA
Bayesian spatial models in INLA
Bayesian spatial models in INLA
Latent models referred in this chapter
Latent models referred in this chapter
Case: housing prices in Boston
Case: housing prices in Boston
Case: housing prices in Boston
Case: housing prices in Boston
Meeting Videos
Cohort 1
10
Disease risk modeling
10.1
Introduction
10.2
Modeling of lung cancer risk in Pennsylvania
10.2.1
Expected cases
10.2.2
Standardized Mortality Ratios
10.3
Modeling diseased risk
10.3.1
Neighborhood structure
10.3.2
Model
10.3.3
Relative Risk
Meeting Videos
Cohort 1
11
Areal data issues
11.1
Areal data issues
Meeting Videos
Cohort 1
12
Geostatistical data
The part about geostatistical data
The part about geostatistical data
Gaussian random fields: what
Gaussian random fields: properties
Covariance functions of GRFs
Covariance functions of GRFs
Covariance functions of GRFs
Covariance functions of GRFs
Covariance functions of GRFs
Simulating GRFs
Simulating GRFs
Simulating GRFs
Simulating GRFs
Simulating GRFs
Summarizing the GRF’s correlation structure
Summarizing the GRF’s correlation structure
Summarizing the GRF’s correlation structure
Summarizing the GRF’s correlation structure
Summarizing the GRF’s correlation structure
Summarizing the GRF’s correlation structure
Summarizing the GRF’s correlation structure
Summarizing the GRF’s correlation structure
Meeting Videos
Cohort 1
13
Spatial interpolation methods
Recap: geostatistical data
Recap: geostatistical data
Recap: geostatistical data
Aim of spatial interpolation
Considered methods
Considered methods
Considered methods
Considered methods
Packages and data
Packages and data
Packages and data
Packages and data
Packages and data
Packages and data
Packages and data
Prediction grid
Prediction grid
Prediction grid
Closest observation method
Closest observation method
Closest observation method
Closest observation method
Approaches for IDW and nearest neighbours
Approaches for IDW and nearest neighbours
Approaches for IDW and nearest neighbours
Approaches for IDW and nearest neighbours
Approaches for IDW and nearest neighbours
Inverse Distance Weighting method (IDW)
Inverse Distance Weighting method (IDW)
Inverse Distance Weighting method (IDW)
Inverse Distance Weighting method (IDW)
Nearest neighbours method
Nearest neighbours method
Nearest neighbours method
Ensemble approach
Ensemble approach
Ensemble approach
Assessing performance with cross-validation
Assessing performance with cross-validation
Meeting Videos
Cohort 1
14
Kriging
14.1
What is Kriging
14.2
Types of Kriging
14.3
Performing Kriging in R
14.3.1
Example: Simple Kriging
14.3.2
Variogram Model
14.3.3
Perform Simple Kriging
14.3.4
Plotting the Results
14.4
Summary
14.5
Additional Resources
Meeting Videos
Cohort 1
15
Model-based geostatistics
Aim
INLA and GRFs
INLA and GRFs
Projection matrix
Example in the book
Preparations before fitting with
inla()
Preparations before fitting with
inla()
Preparations before fitting with
inla()
Preparations before fitting with
inla()
Preparations before fitting with
inla()
Preparations before fitting with
inla()
Fit the model
Extract results
Meeting Videos
Cohort 1
16
Methods assessment
Overview
Obtaining training and testing datasets
Predictive performance measures
Meeting Videos
Cohort 1
17
Spatial point patterns
SLIDE 1
Meeting Videos
Cohort 1
18
The spatstat package
SLIDE 1
Meeting Videos
Cohort 1
19
Spatial point processes and simulation
Spatial point process vs. spatial point pattern
Intensity function of a spatial point process
Intensity function of a spatial point process
Intensity function of a spatial point process
Commonly used special cases
Commonly used special cases
Commonly used special cases
Poisson processes: what’s next
Simulating spatial point patterns
Simulating spatial point patterns
Example: homogeneous
Example: homogeneous
Example: homogeneous
Example: homogeneous
Example: heterogeneous
Example: heterogeneous
Example: heterogeneous
Example: heterogeneous
Example: heterogeneous
Example: heterogeneous
Example: heterogeneous
Example: heterogeneous
Meeting Videos
Cohort 1
20
Complete spatial randomness
Complete spatial randomness
Randomness of a given spatial point pattern
Test statistic
Test statistic
Possible outcomes
spatstat functions
Example: longleaf
Example: longleaf
Example: longleaf
Example: longleaf
Example: longleaf
Example: longleaf
Example: longleaf
Meeting Videos
Cohort 1
21
Intensity estimation
SLIDE 1
Meeting Videos
Cohort 1
22
The K-function
SLIDE 1
Meeting Videos
Cohort 1
23
Point process modeling
Considering intensity as a stochastic variable
Considering intensity as a stochastic variable
Considering intensity as a stochastic variable
Considering intensity as a stochastic variable
Similarities with chapter 15 (model-based geostatistics)
Differences with chapter 15 (model-based geostatistics)
Aim in chapter 15 (model-based geostatistics)
How to model a spatial point process with INLA?
How to model a spatial point process with INLA?
Projection matrix for spatial point processes
Projection matrix for spatial point processes
Projection matrix for spatial point processes
Example in the book
Example in the book
Example in the book
Example in the book
Example in the book
Preparations before fitting with
inla()
Create the mesh
Create the mesh
Create the dual mesh
Create the dual mesh
Calculate the offsets (surface areas)
Calculate the offsets (surface areas)
Define the SPDE model
Define the SPDE model
Construct the projection matrices
Construct the projection matrices
Construct the projection matrices
Preparations before fitting with
inla()
Stack with data for estimation and prediction
Stack with data for estimation and prediction
Fit the model
Extract results
Extract results
Extract results
Extract results
Meeting Videos
Cohort 1
Published with bookdown
Spatial Statistics for Data Science: Theory and Practice with R Book Club
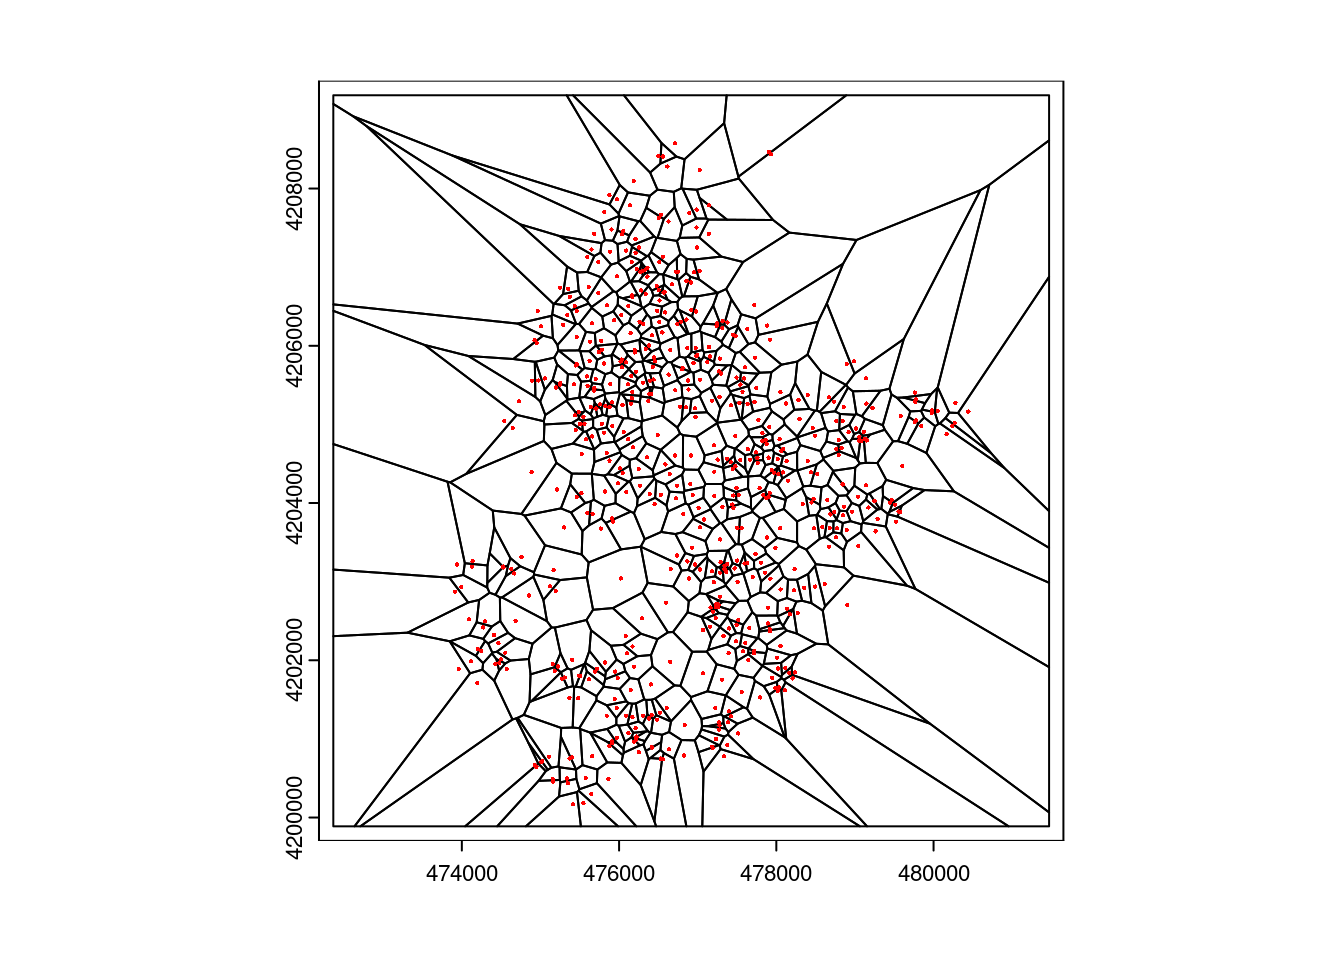
Closest observation method
plot
(vor)
points
(
vect
(d),
cex =
0.3
,
col =
"red"
)