st_coordinates()
sf
inla()
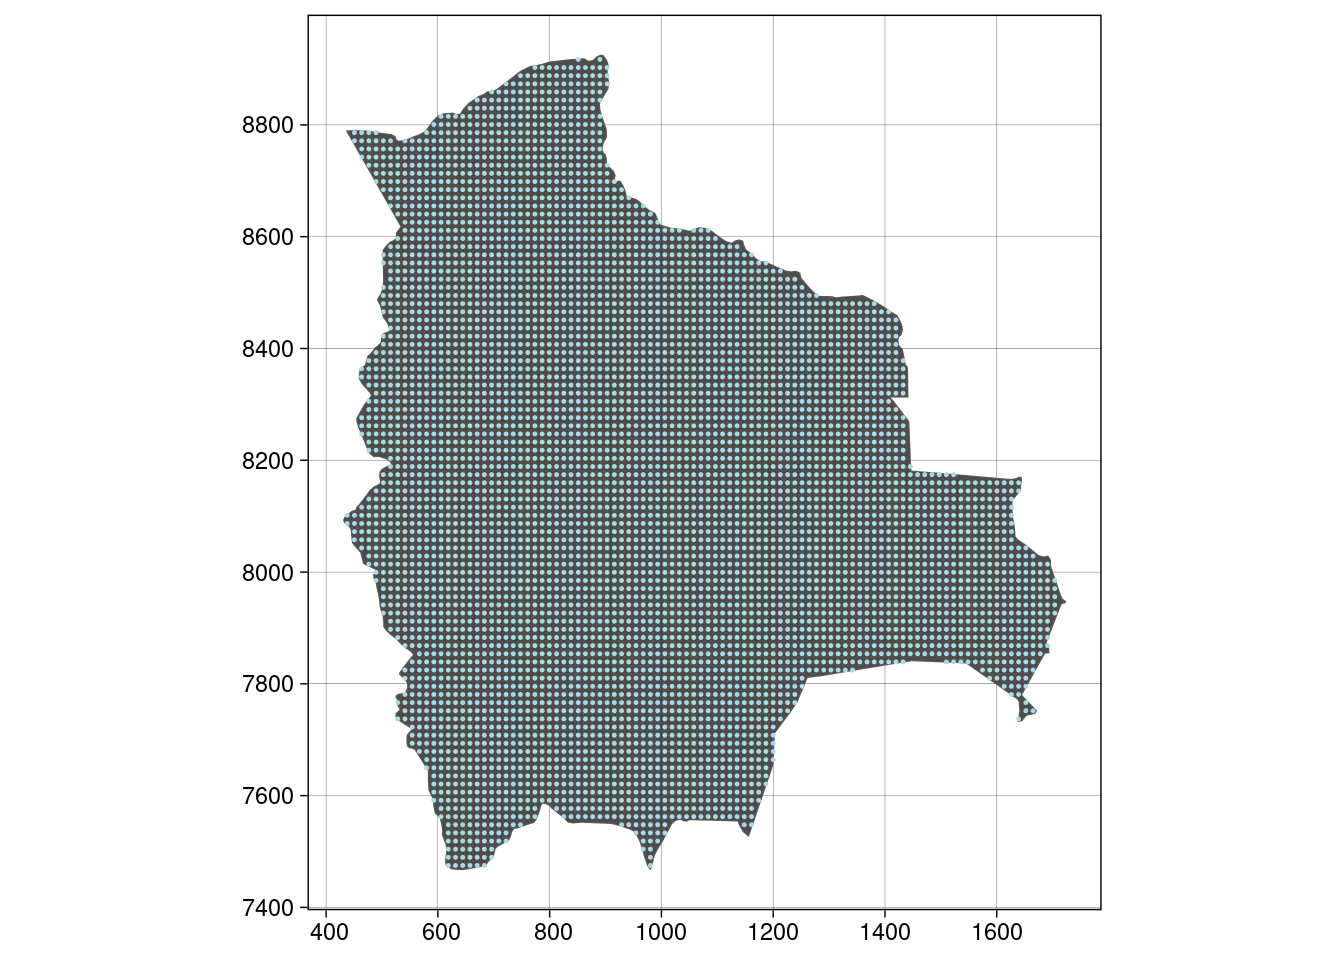
ggplot() +
  geom_sf(data = map, fill = "grey30") +
  geom_sf(data = dp, colour = "lightblue", size = 0.2) +
  coord_sf(datum = projUTM) +
  theme_linedraw()