Exercise 3.3.7
Repeat Exercise 3.1.2 but use thin QR factorization rather than backlash operator
counts = [3.929, 5.308, 7.240, 9.638, 12.87, 17.07, 23.19, 31.44, 39.82, 50.19, 62.95, 76.21, 92.22, 106.0, 122.8, 132.2, 150.7, 179.3, 203.3, 226.5, 248.7, 281.4, 308.7];

years =  collect(1790:10:2010);
scatter(years, counts,title="US Population)", label = "data",
    xlabel=L"Year",ylabel=L"millions")
Use lsqrfact:
A = [years.^0 years.^1 years.^2 years.^3];
c = FNC.lsqrfact(A, counts)

#4-element Vector{Float64}:
# -20617.55777543976
#     42.913662533882025
#     -0.02866659442717994
# 6.216970710425838e-6 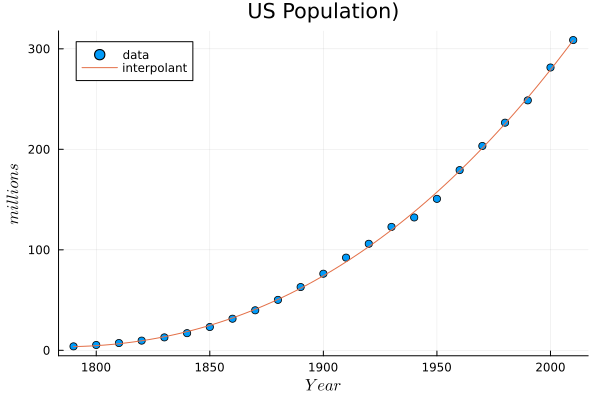 Predicted population in 2020:
Actual: 331.4