14.2 Example: Clinical Trial
## 'data.frame':    18 obs. of  3 variables:
##  $ drug     : Factor w/ 3 levels "placebo","anxifree",..: 1 1 1 2 2 2 3 3 3 1 ...
##  $ therapy  : Factor w/ 2 levels "no.therapy","CBT": 1 1 1 1 1 1 1 1 1 2 ...
## $ mood.gain: num 0.5 0.3 0.1 0.6 0.4 0.2 1.4 1.7 1.3 0.6 ...## drug therapy mood.gain
## 1 placebo no.therapy 0.5
## 2 placebo no.therapy 0.3
## 3 placebo no.therapy 0.1
## 4 anxifree no.therapy 0.6
## 5 anxifree no.therapy 0.4
## 6 anxifree no.therapy 0.2
## 7 joyzepam no.therapy 1.4
## 8 joyzepam no.therapy 1.7
## 9 joyzepam no.therapy 1.3
## 10 placebo CBT 0.6
## 11 placebo CBT 0.9
## 12 placebo CBT 0.3
## 13 anxifree CBT 1.1
## 14 anxifree CBT 0.8
## 15 anxifree CBT 1.2
## 16 joyzepam CBT 1.8
## 17 joyzepam CBT 1.3
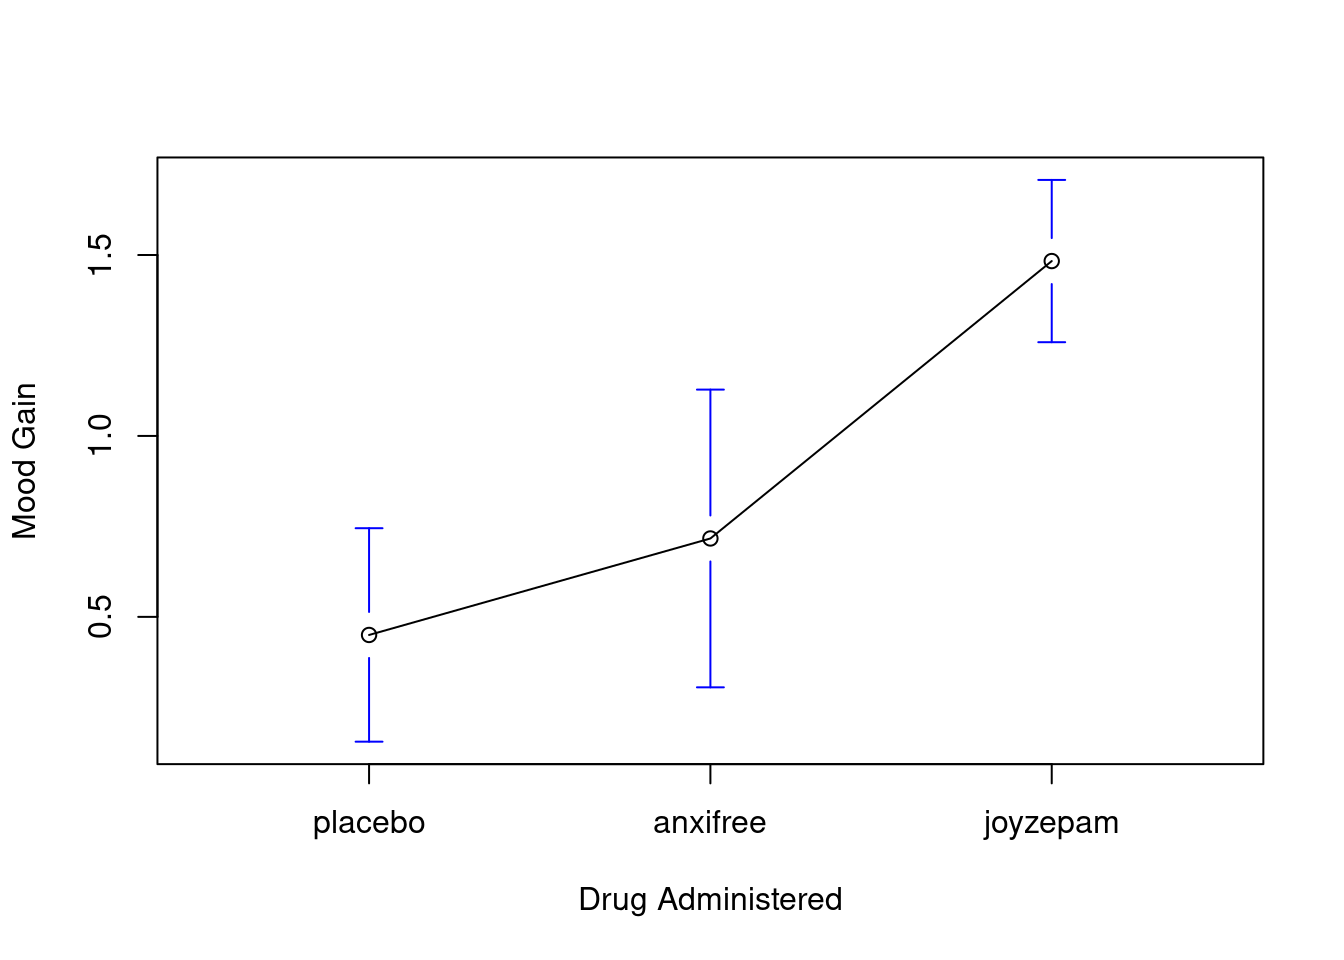
## 18 joyzepam CBT 1.4We look at the effect of drug on mood.gain
library(tidyverse)
clin.trial%>%
  group_by(drug)%>%
  reframe(avg_mood.gain=mean(mood.gain),
          sd_mood.gain=sd(mood.gain))
## # A tibble: 3 × 3
## drug avg_mood.gain sd_mood.gain
## <fct> <dbl> <dbl>
## 1 placebo 0.45 0.281
## 2 anxifree 0.717 0.392
## 3 joyzepam 1.48 0.214gplots::plotmeans(formula = mood.gain ~ drug, # plot mood.gain by drug
data = clin.trial, # the data frame
xlab = "Drug Administered", # x-axis label
ylab = "Mood Gain", # y-axis label
n.label = FALSE )