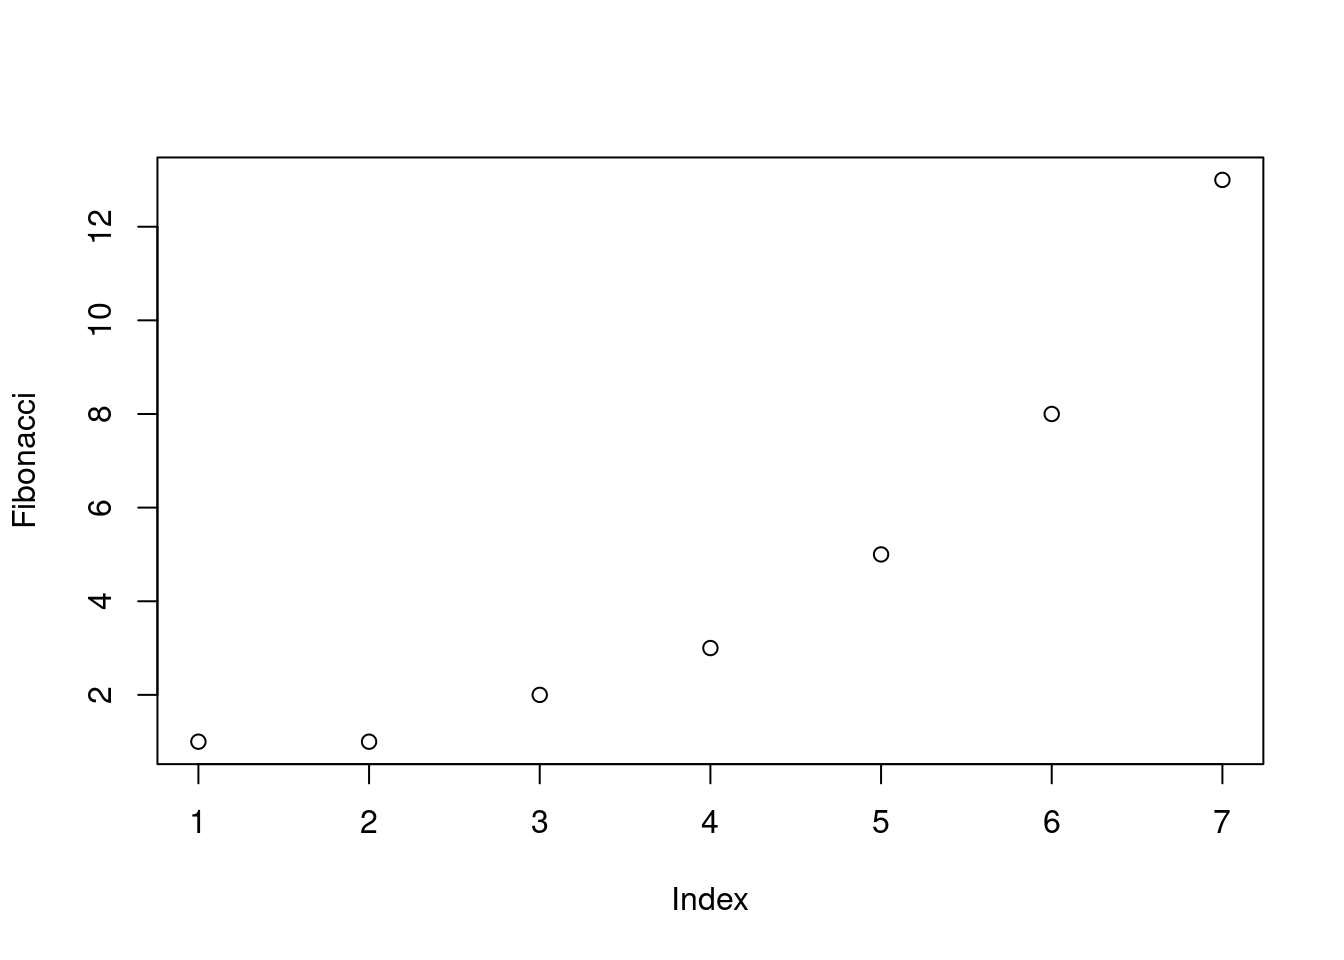
A simple intro to how to make a plot with the Fibonacci sequence data:
Fibonacci <- c( 1,1,2,3,5,8,13 )
plot( Fibonacci )