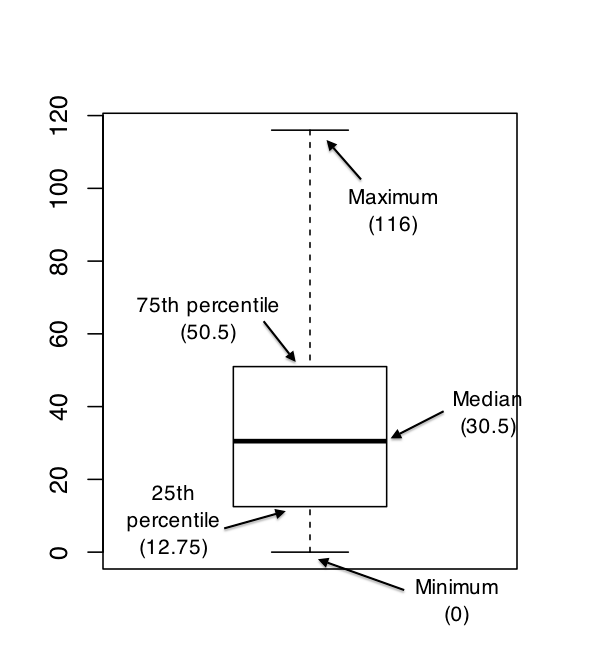
6.6 Boxplots
##    Min. 1st Qu.  Median    Mean 3rd Qu.    Max.
##    0.00   12.75   30.50   35.30   50.50  116.00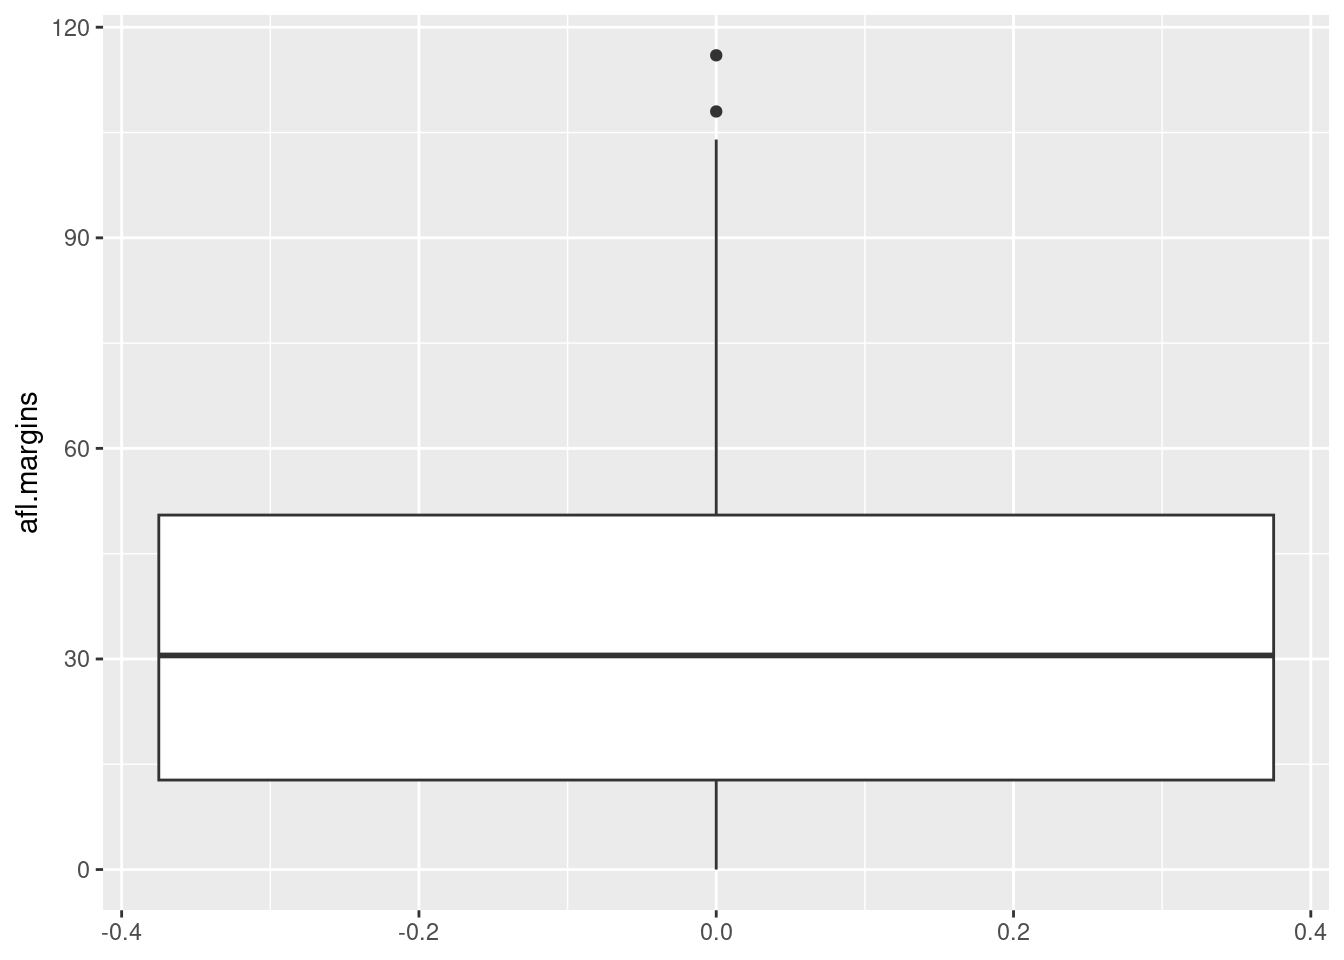
##    -- Name --       -- Class --   -- Size --
##    afl.finalists    factor        400
##    afl.margins      numeric       176
##    afl.margins_df   data.frame    176 x 1
##     $afl.margins    numeric       176
##    afl2             data.frame    4296 x 2
##     $margin         numeric       4296
##     $year           numeric       4296
##    Fibonacci        numeric       7
##    islands_df       tbl_df        48 x 2
##     $values         numeric       48
##     $islands        character     48
##    slist            list          528
##    Snow.deaths      data.frame    578 x 3
##     $case           integer       578
##     $x              numeric       578
##     $y              numeric       578
##    Snow.streets     data.frame    1241 x 4
##     $street         integer       1241
##     $n              integer       1241
##     $x              numeric       1241
##     $y              numeric       1241
## x numeric 7## margin year
## 1 33 1987
## 2 59 1987
## 3 45 1987
## 4 91 1987
## 5 39 1987
## 6 1 1987afl2_df <- data.frame(afl2)
afl2_df %>%
ggplot(aes(x=year,
y=margin,group=year))+
geom_boxplot()+
geom_hline(aes(yintercept=(mean(margin))),color="red")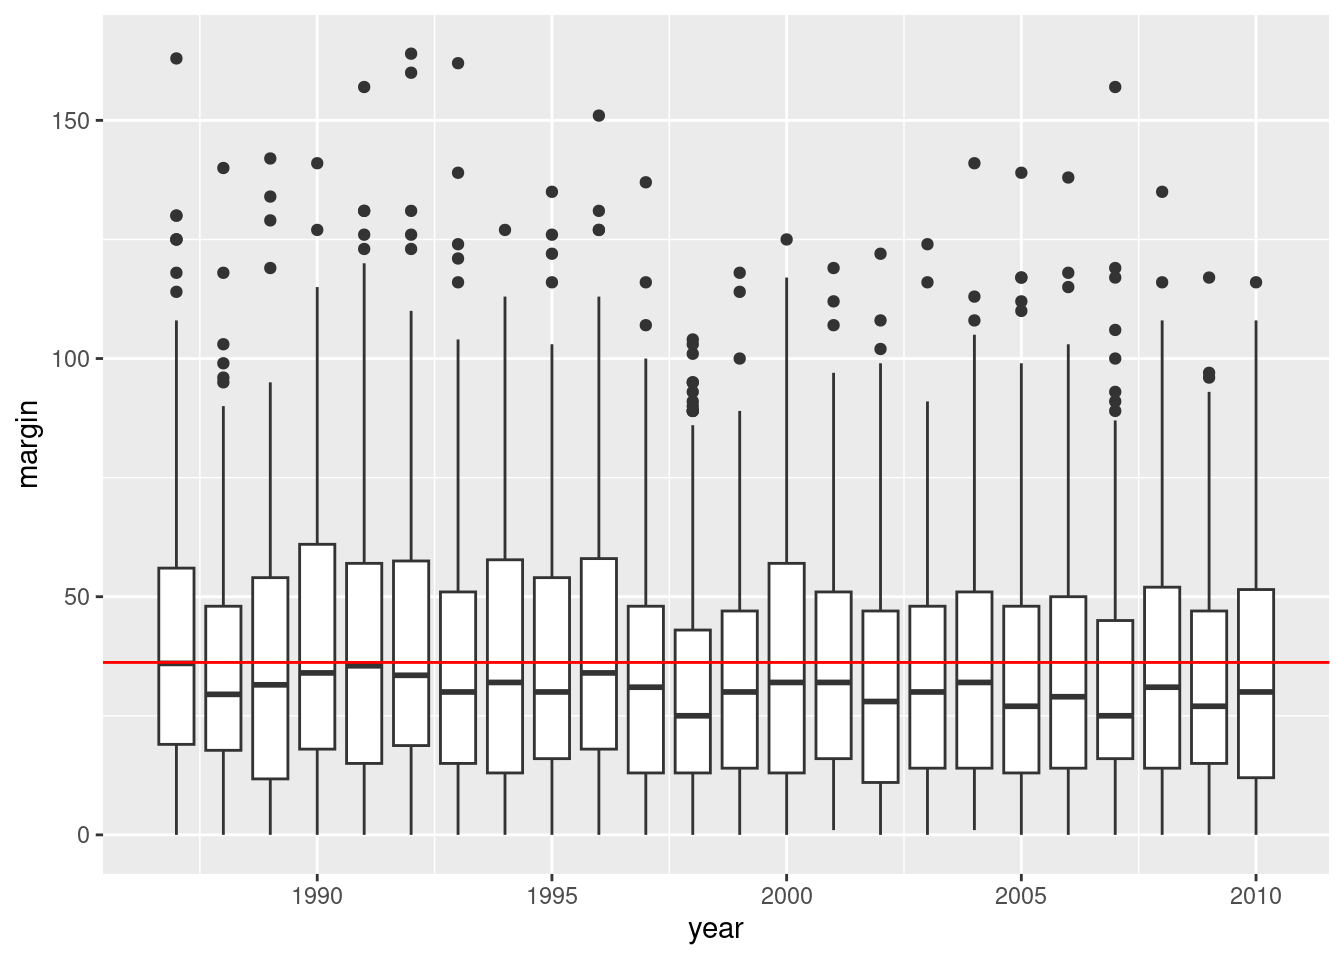
Figure 6.1: AFL winning margins for the 24 years from 1987 to 2010 inclusive