2.4 Examining how sentiment changes in each novel
(tidy_books <- books %>%
  unnest_tokens(word, text))
## # A tibble: 725,055 × 4
## book linenumber chapter word
## <fct> <int> <int> <chr>
## 1 Sense & Sensibility 1 0 sense
## 2 Sense & Sensibility 1 0 and
## 3 Sense & Sensibility 1 0 sensibility
## 4 Sense & Sensibility 3 0 by
## 5 Sense & Sensibility 3 0 jane
## 6 Sense & Sensibility 3 0 austen
## 7 Sense & Sensibility 5 0 1811
## 8 Sense & Sensibility 10 1 chapter
## 9 Sense & Sensibility 10 1 1
## 10 Sense & Sensibility 13 1 the
## # … with 725,045 more rowsjane_austen_sentiment <- tidy_books %>%
inner_join(get_sentiments("bing"), by = "word") %>%
count(book, index = linenumber %/% 80, sentiment) %>%
pivot_wider(names_from = sentiment, values_from = n, values_fill = 0) %>%
mutate(sentiment = positive - negative)
jane_austen_sentiment## # A tibble: 920 × 5
## book index negative positive sentiment
## <fct> <dbl> <int> <int> <int>
## 1 Sense & Sensibility 0 16 32 16
## 2 Sense & Sensibility 1 19 53 34
## 3 Sense & Sensibility 2 12 31 19
## 4 Sense & Sensibility 3 15 31 16
## 5 Sense & Sensibility 4 16 34 18
## 6 Sense & Sensibility 5 16 51 35
## 7 Sense & Sensibility 6 24 40 16
## 8 Sense & Sensibility 7 23 51 28
## 9 Sense & Sensibility 8 30 40 10
## 10 Sense & Sensibility 9 15 19 4
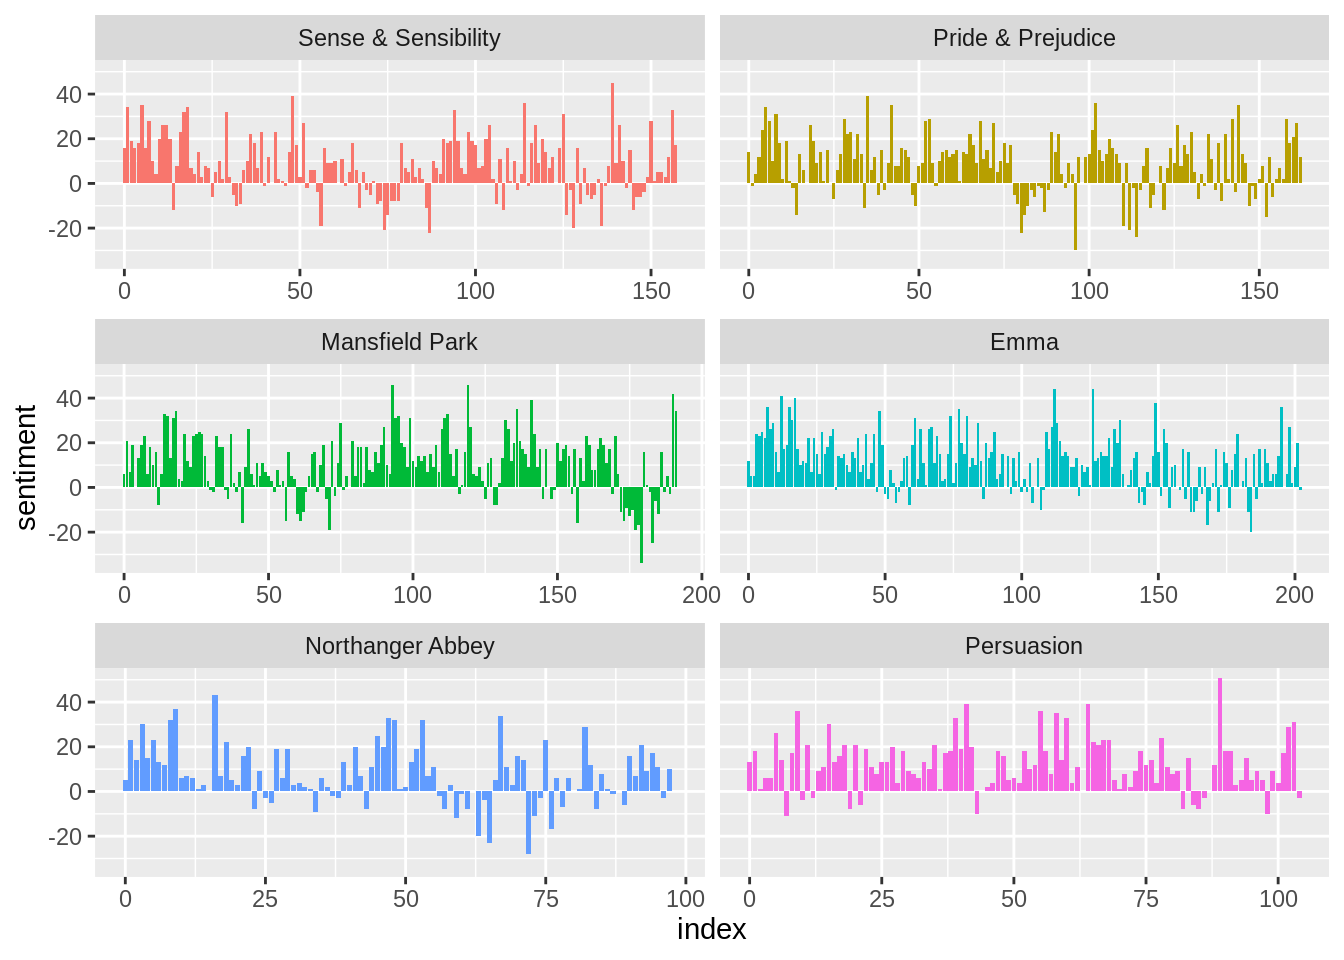
## # … with 910 more rowsNow we can plot these sentiment scores across the plot trajectory of each novel. plotting against the index on the x-axis that keeps track of narrative time in sections of text.
library(ggplot2)

ggplot(jane_austen_sentiment, aes(index, sentiment, fill = book)) +
  geom_col(show.legend = FALSE) +
  facet_wrap(~book, ncol = 2, scales = "free_x")