Data Project Architecture
Learning objectives
- Learn about the three-layer app.
- Learn why the presentation layer is important and how can we handle its data.
- Learn about APIs.
The three layer architecture
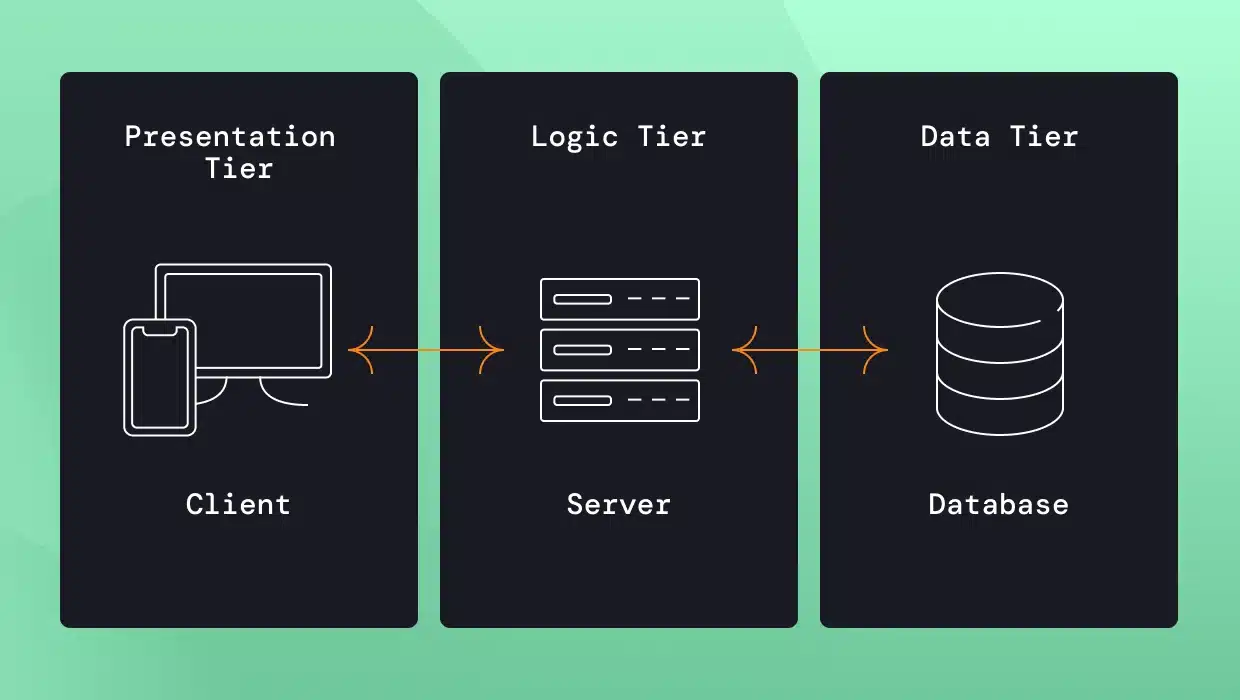
Poorly-architected software is likely to break when you share it or go to production. A standard software arquitechture for apps:
![]()
Three layer app
Is it for Data Science projects?
The three layers can help clarify parts of our projects, but:
- We might not be designing an app
- We usually have projects with many components
- Apps run in response to user actions, data science projects run in response to updates to the data
- We usually don’t have ownership on the data
The presentation layer
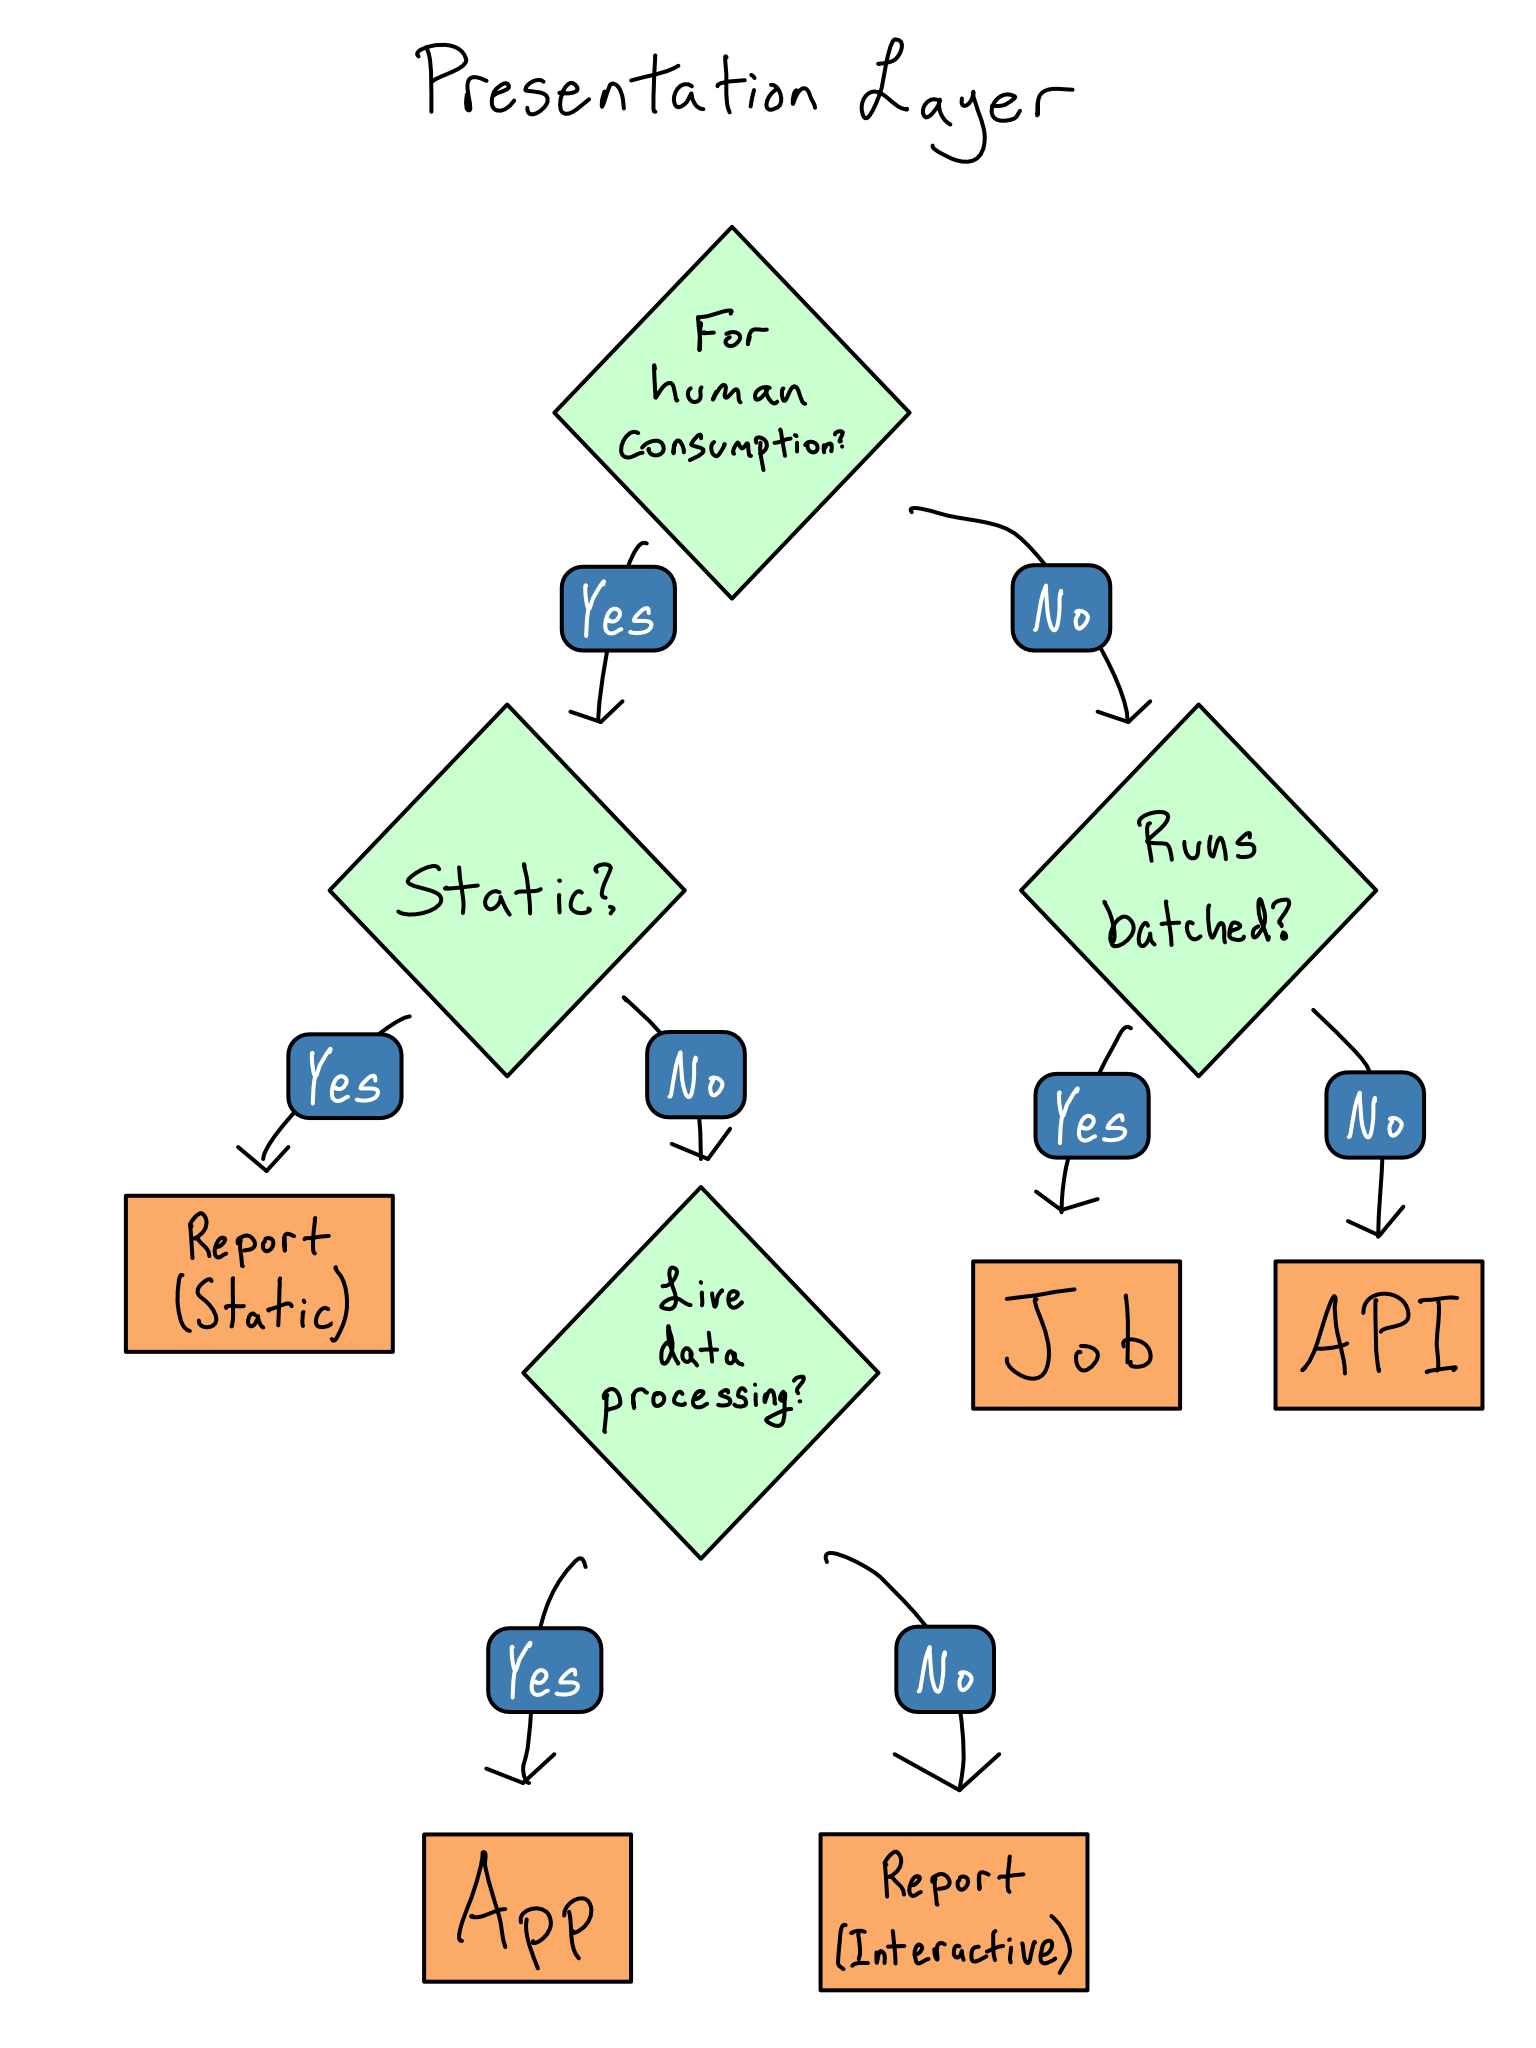
It is what our users will consume, so we have to choose it first. Options:
- A job: it changes something in another system.
- An app: data science web apps to explore datasets.
- A report: might be static or have some interactive elements.
- An API: for machine-to-machine communication.
![]()
Decision workflow for presentation layer
Other things to consider for the presentation layer
- Do less here. Keep only code that shows something to the user or that collects input from the user
- Have small data here, you want high performance.
- Can you precalculate anything before it goes to the presentation layer?
- Can you reduce the granularity of your data? Figure out the dimensions that will make sense to the user
How to make big data small
Don’t pull all the data into your session. Instead:
- Push work to the data source: do anything you can do before you pull the data out.
- Be lazy with data pulls: pull the data that’s needed when it’s needed.
- Sample the data. Makes sense for machine learning tasks but not for counting.
- Chunk and pull. Identify natural groups.
Where to store the data
It depends on how often it is updated. In the presentation bundle, only if the data and the app will be updated together.
- Filesystem: hard for deployment.
- Blob storage or pins: cloud storage like S3 from Amazon, Google Storeage or Azure. They usually have packages.
- Google sheets: maybe as an intermediate step.
You can also store your intermediate artifacts in .csv, pickle or rds files or use DuckDB.
How about an API?
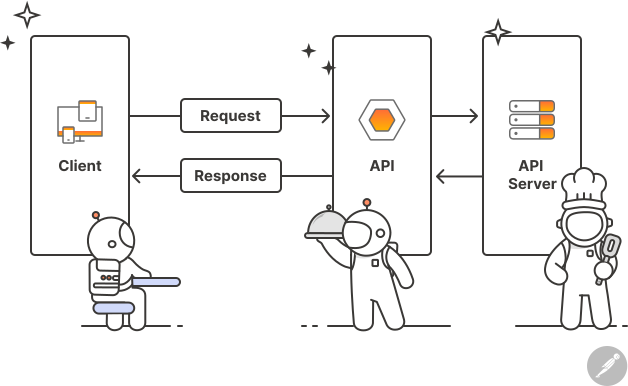
- API: Application Programming Interface.
- Suited for the middle tier, you separate the processing logic into functions.
- Function as a service. Functions, but in a completely separate process.
{fastAPI} and {plumber} can help.
REST APIs
- REpresentational State Transfer:
- Resources and URLs to identify each function.
- HTTP methods for CRUD operations.
- Stateless: no client-specific context.
- Representations for requests and reponses: Json or XML.
Dataverse Access API
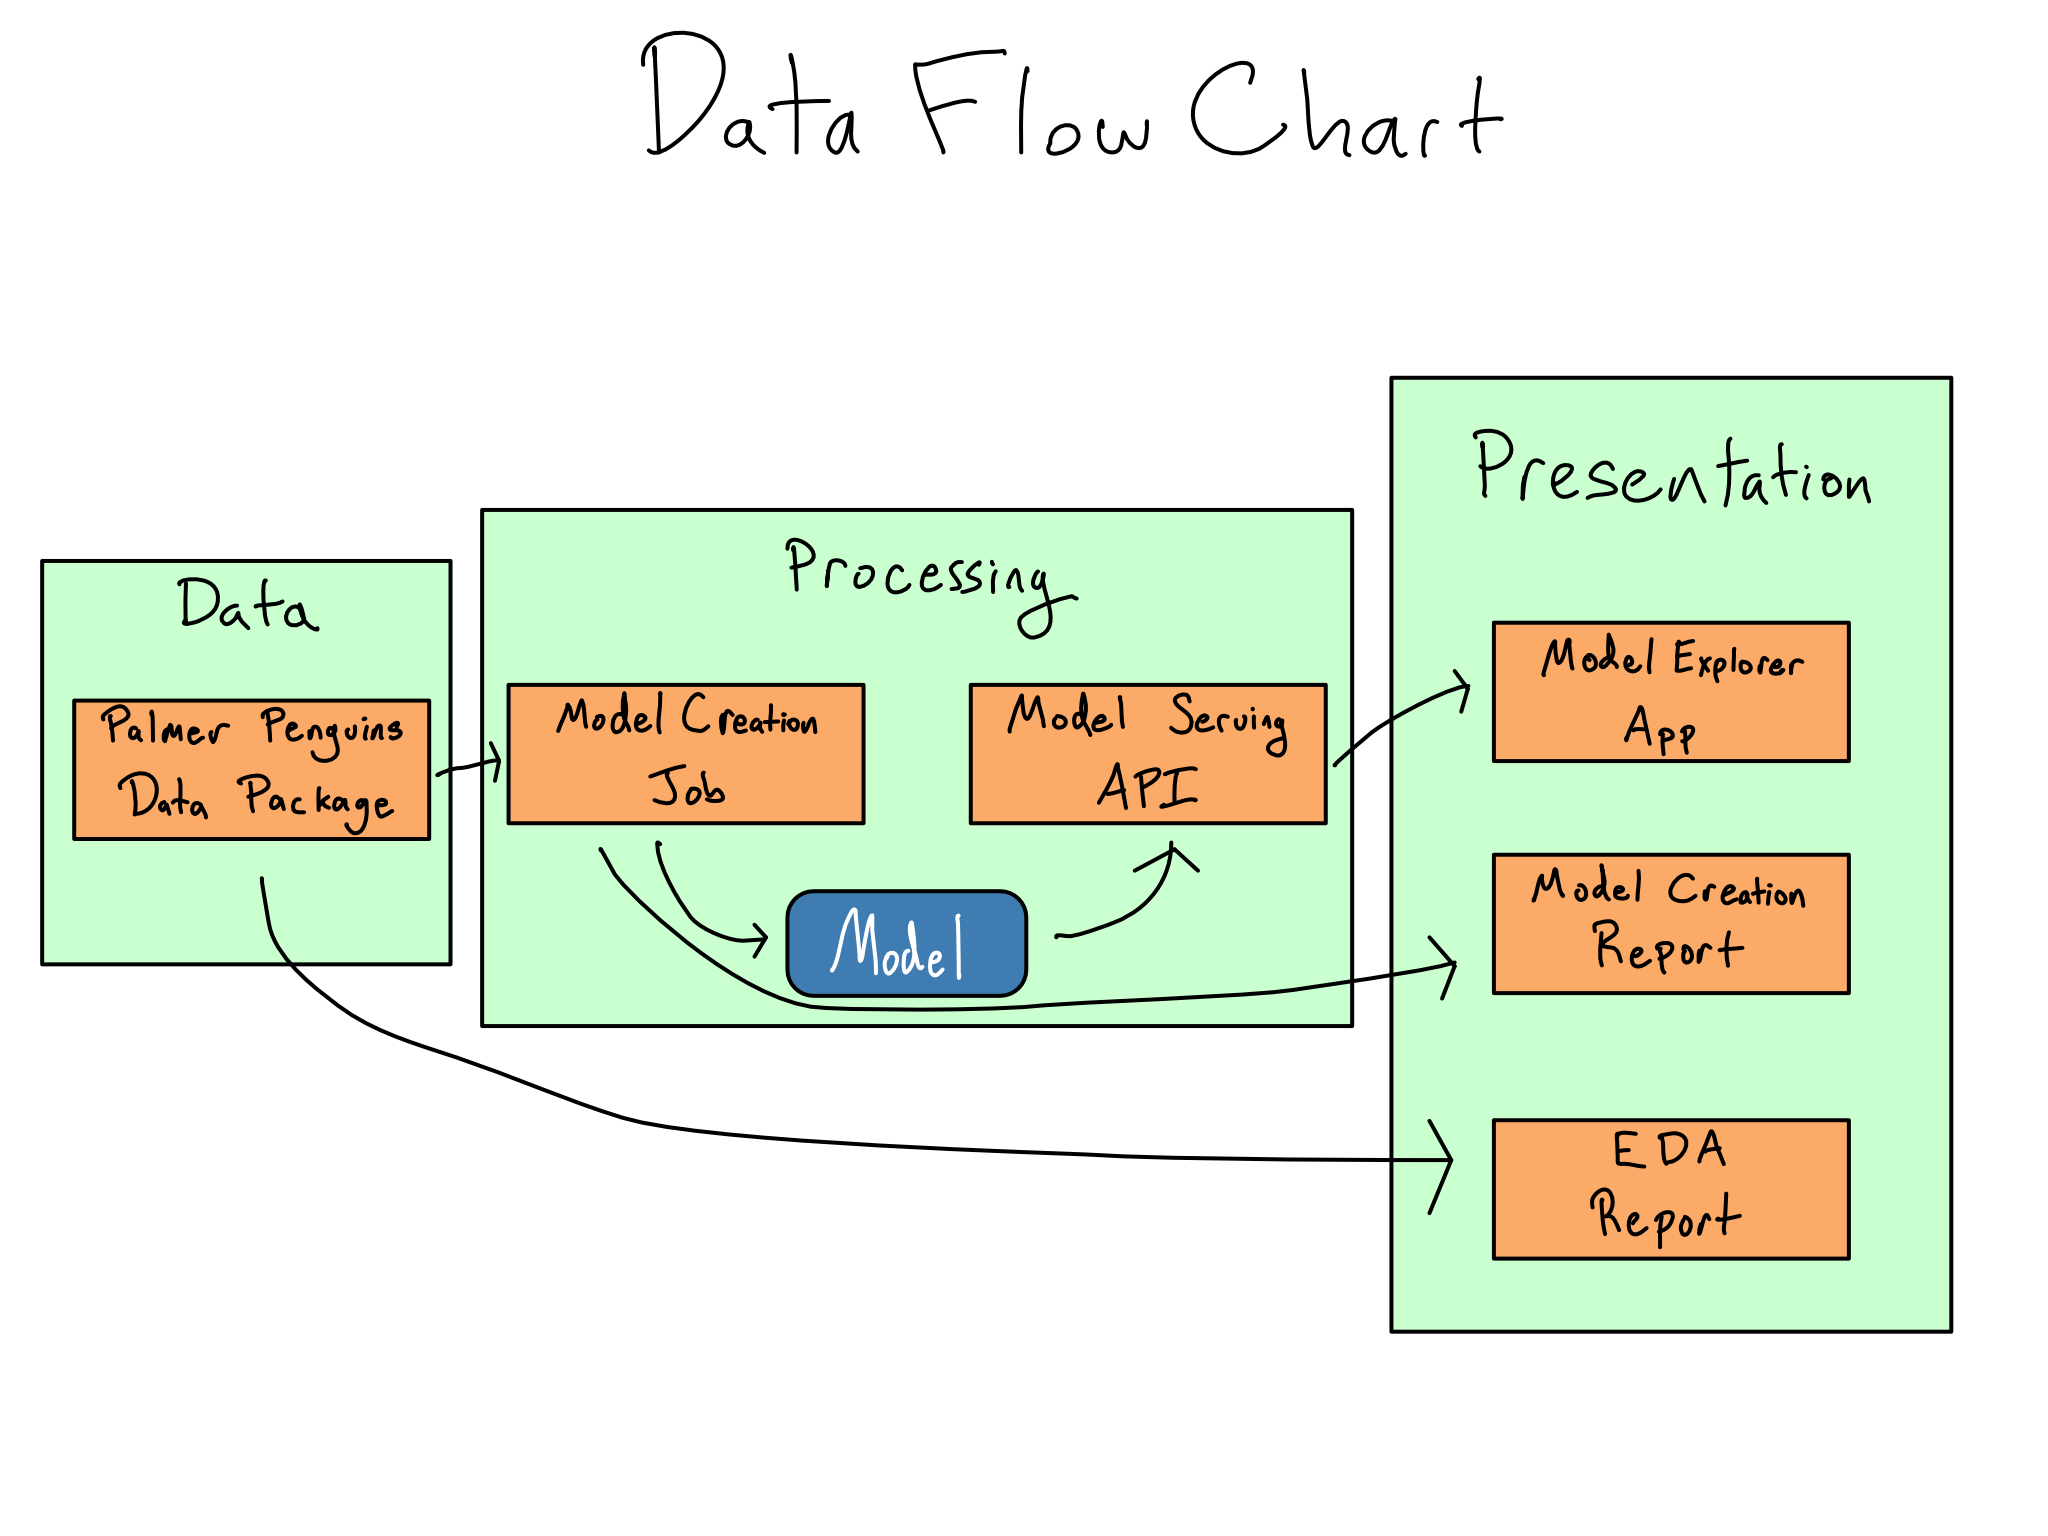
Write a data flow chart
![]()
Data flow chart
Review
Comprehension questions
- Do you ever think about your application layer?
- What libraries could you use to implement a three-layer architecture in R or Python?
- How do you reduce the data requirements for your project?
- How do you handle your intermediate artifacts?