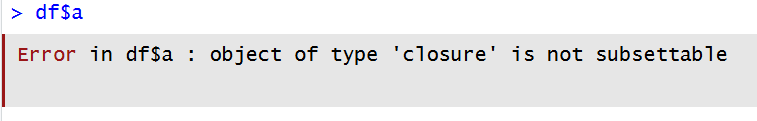
#> [1] FALSE#> [1] TRUEAnd then of course there’s this classic:
Explanation: df is a closure, in this case, the function stats::df(), the density of F-distribution. (It is not a data frame, as you thought it was, ha!) It does not have elements that you could subset.
Parenthesis mismatches
[[...]] vs. [...]
== vs. =
Comparing real numbers exactly using == after calculations that result in non-integers
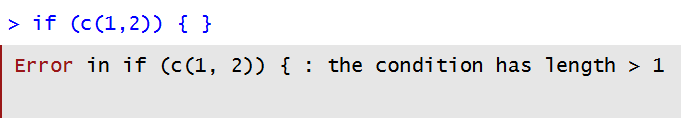
You expect a single value but your code gives you a vector
identical() or all(), or form the condition more thoroughly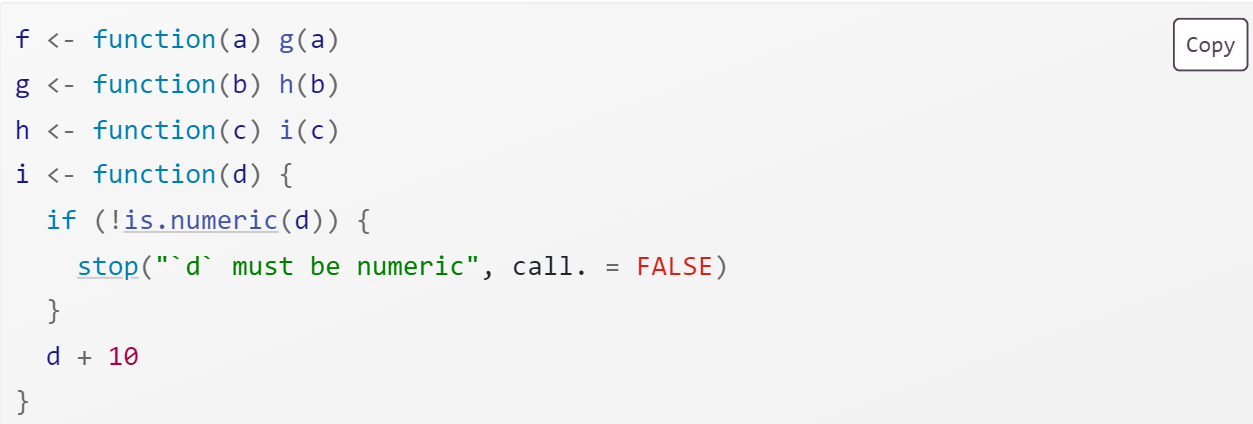
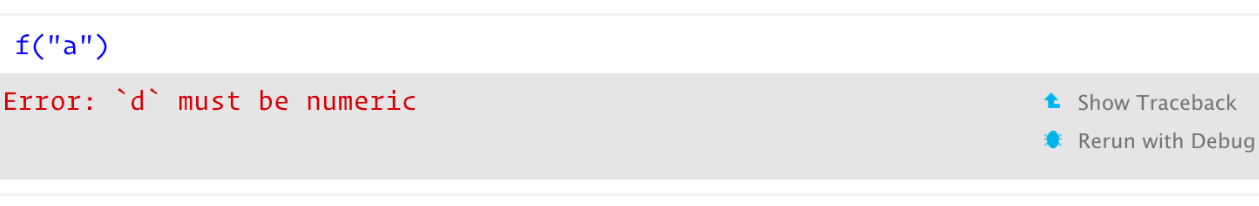
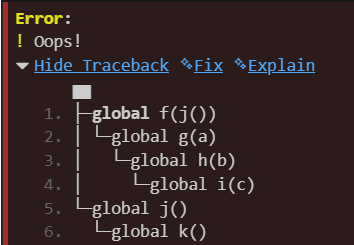
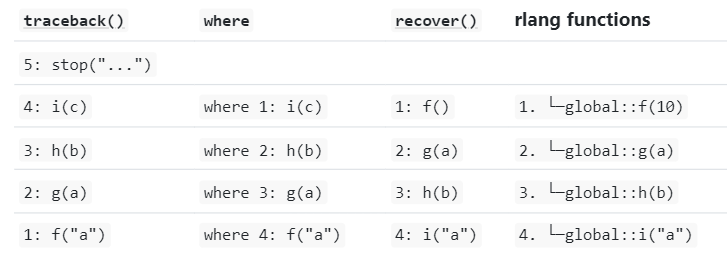
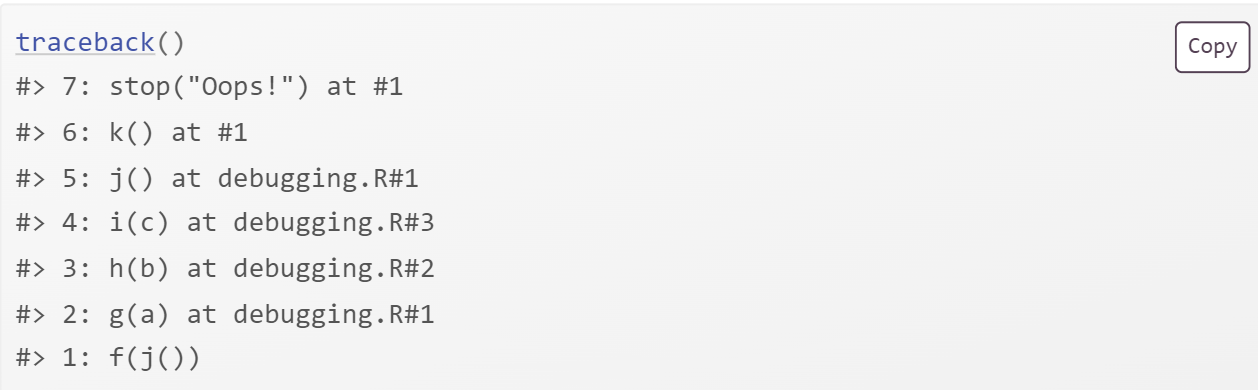
traceback() shows the call stack that lead to the errorClick “Show traceback”:: 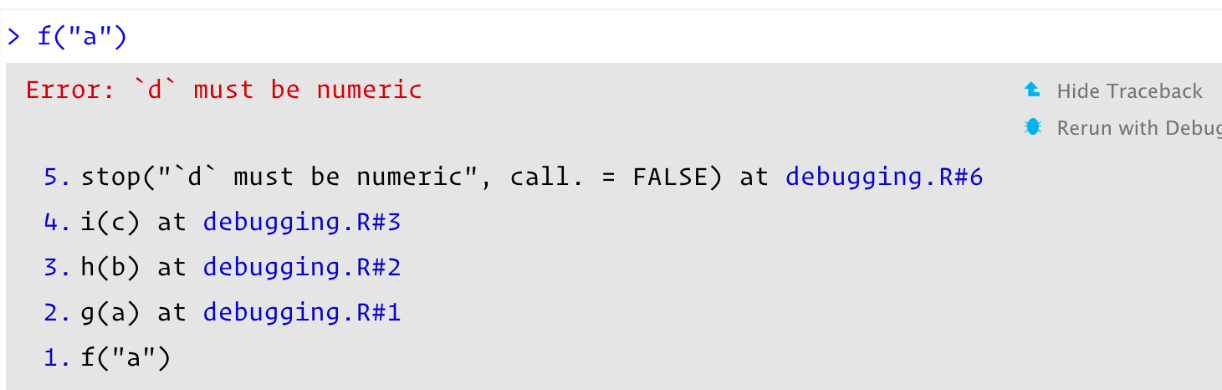
Read bottom to top.
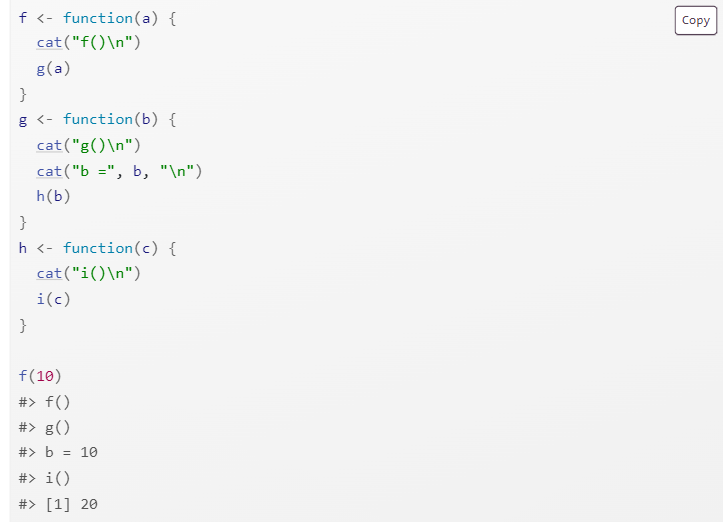
traceback() is confusing with lazy evaluation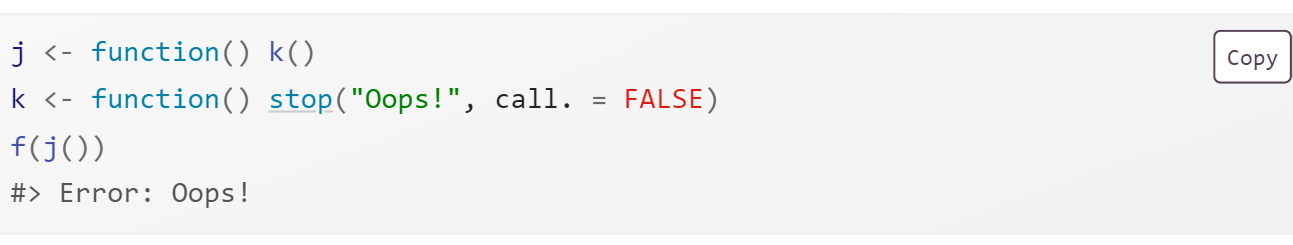
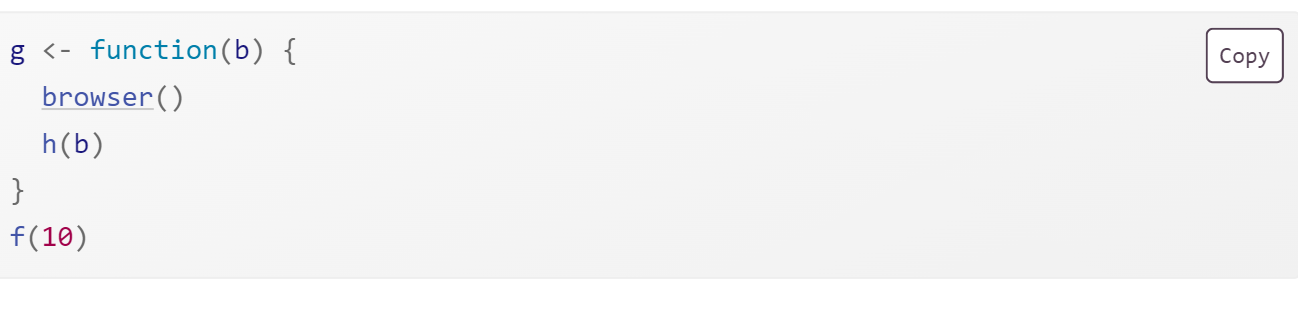
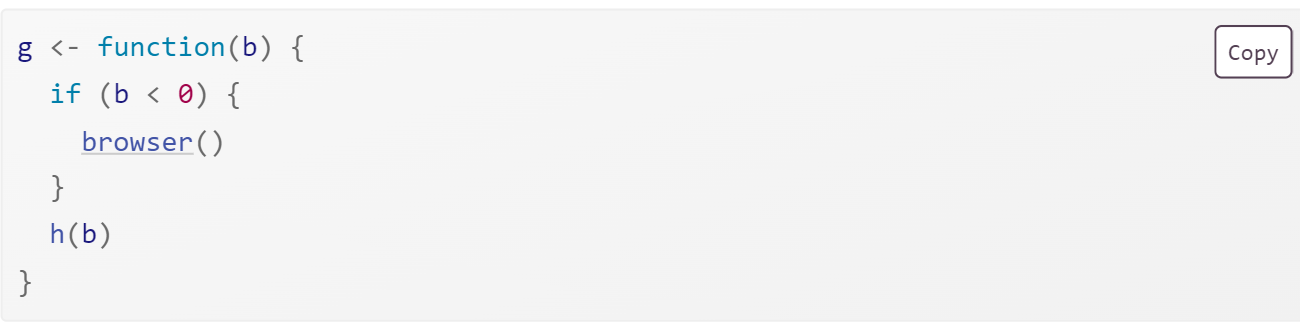
rlang::global_handle() in .Rprofile makes traceback betterbrowser() to set a break point in codebrowser() can be conditionalA better practice would be to define your own debugging flags that would be turned off or disappear in production code
if (exists("my_debugging_flag")) browser()browser() provides special commandsThese commands work in the Console; RStudio also makes the toolbar buttons available.
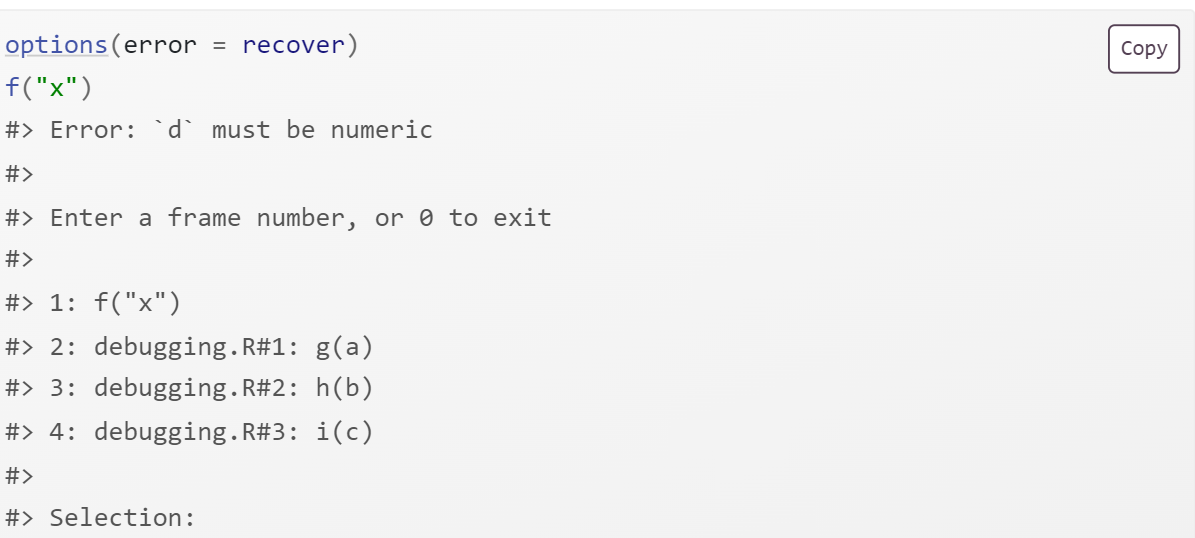
n): Execute the next steps): Dive into function (or n)f): Finish execution of the current loop/functionc): Continue regular execution of the function (leave interactive)Q): Stop debugging, terminate the function, and return to the global workspaceoptions(error = recover) for interactive debugging promptTurn off with options(error = NULL)
traceback(), browser() & where, and recover() are not consistenttraceback()recover()
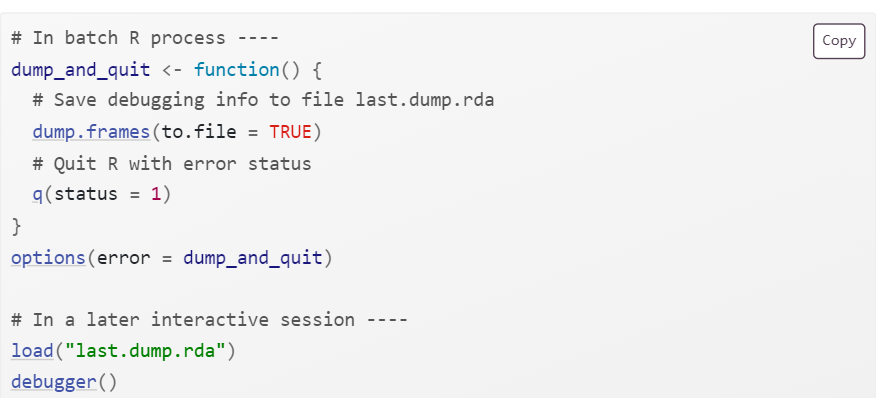
dump.frames() is the equivalent to recover() for non-interactive code.rmarkdown::render("path/to/file.Rmd") instead of IDE knitting.
sink() for tricksy error handling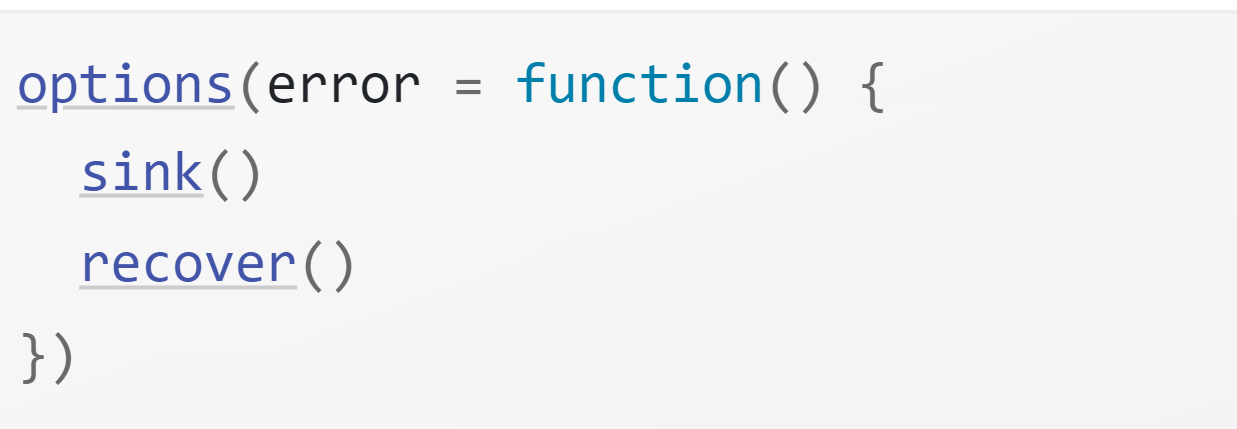
See also “Markdown test drive” in Jenny Bryan’s Happy Git With R book.